
IntoTheBlock, ITB, is a tribe of data scientists, cryptocurrency experts, and AI geeks that are trying to unlock the mysteries of crypto assets. They provide investors with relevant intelligence about the market with their unique indicators and metrics. IntoTheBlock has been created to leverage the power of machine learning to generate new insights about this fascinating asset class. For this, we had Nicolas Contasti, Head of Sales & Business Development, and Francesco Galati from the Business Development team at ITB to tell us more about their services and products.
Interview Date : 16th February 2021
What is the In/Out of the Money indicator?
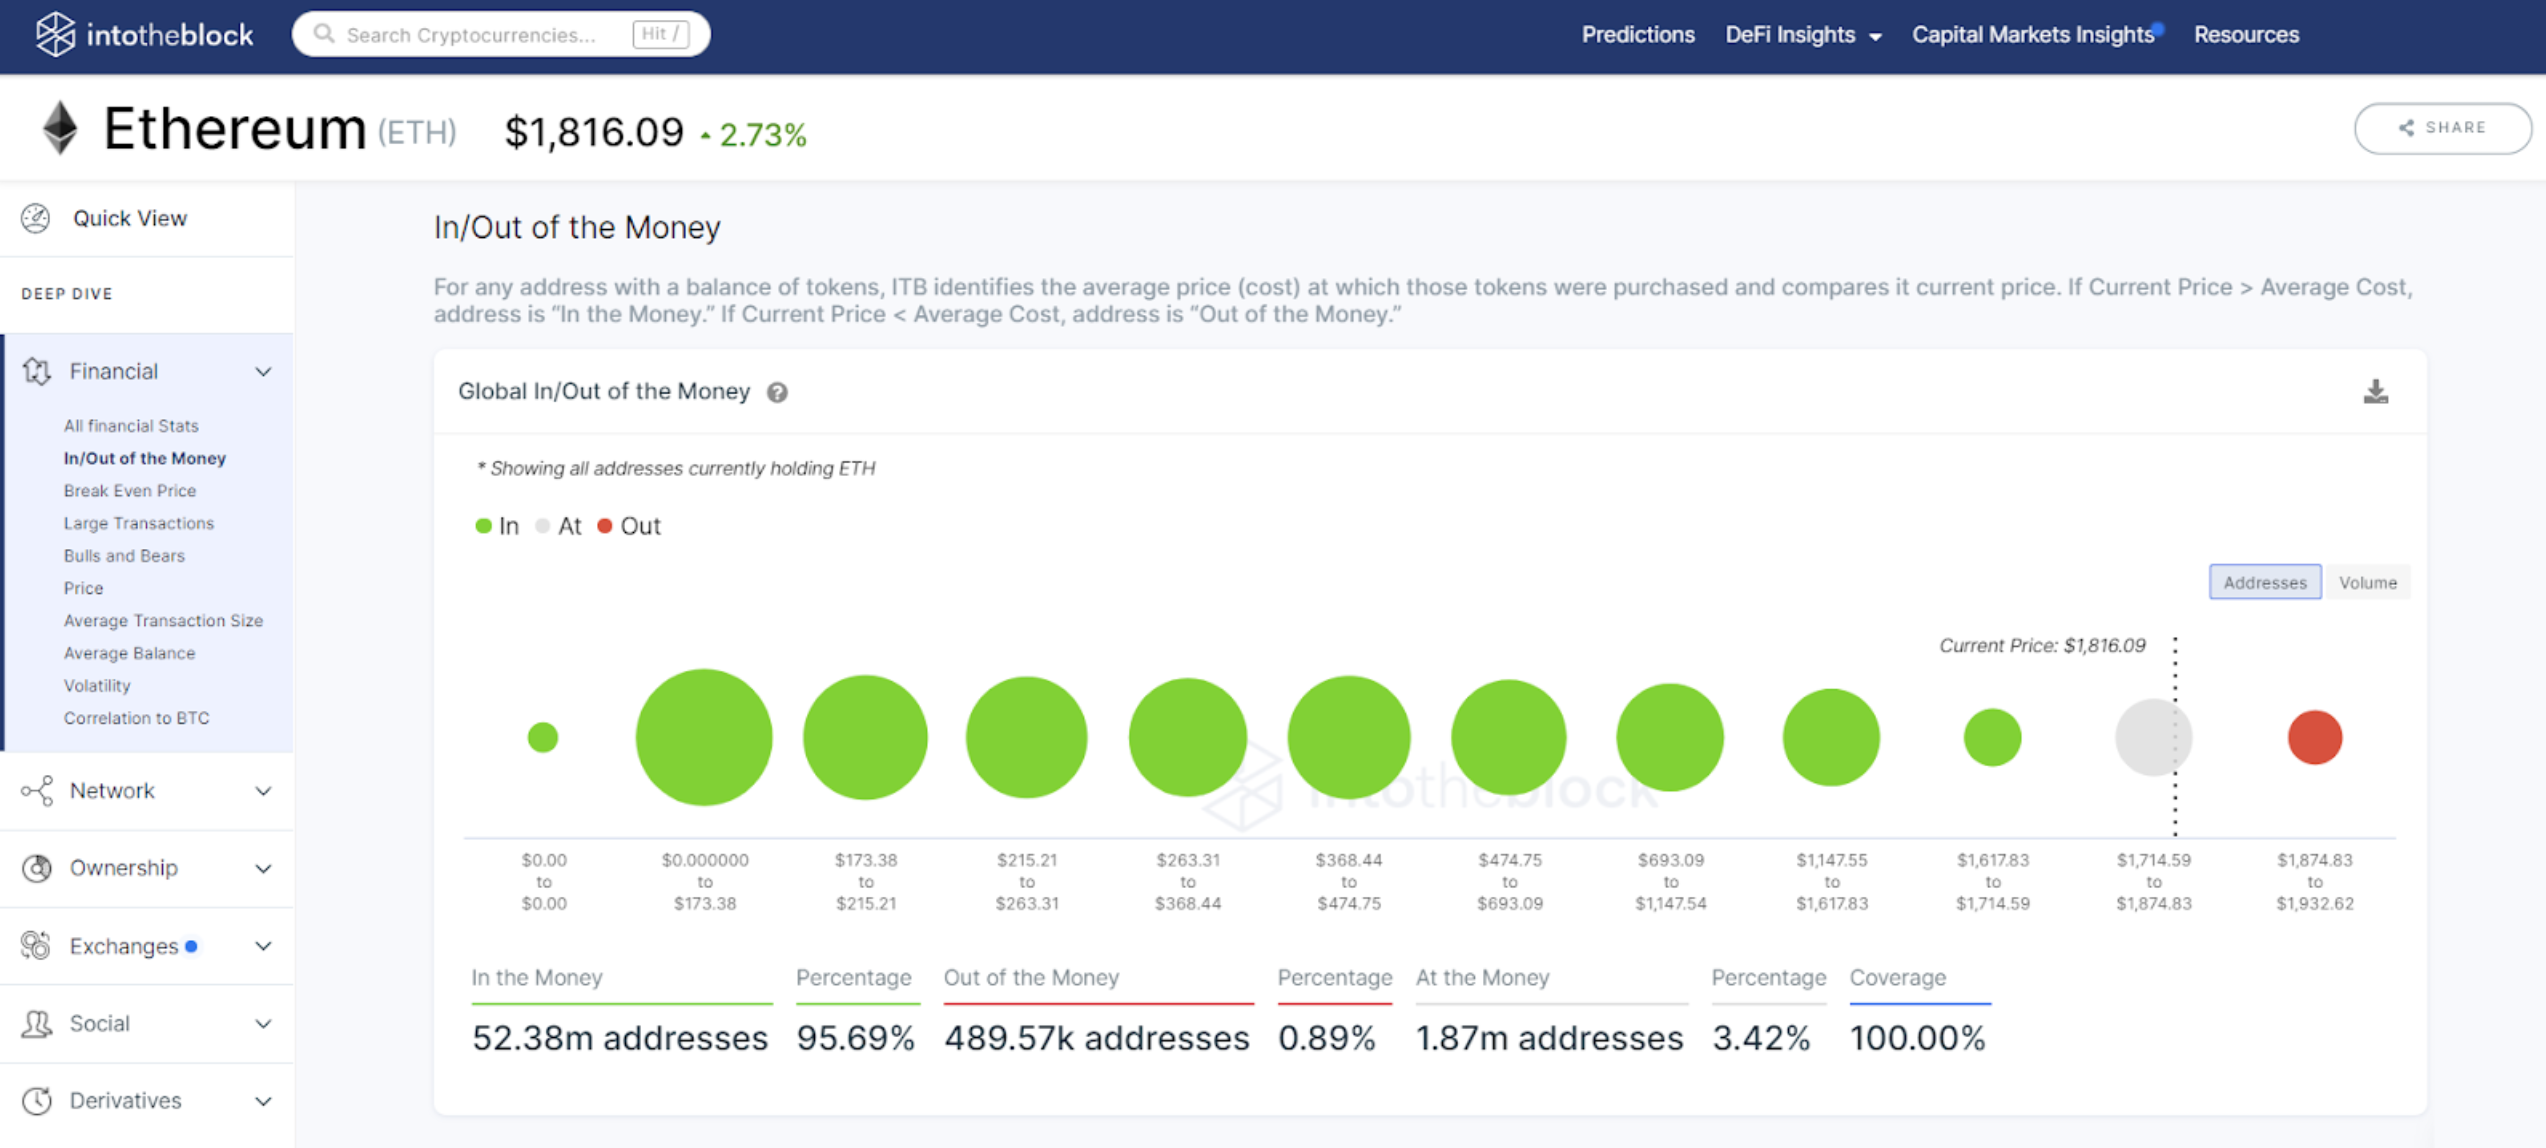
Nicolas: The “In/Out of the Money” indicator gives our users a real picture of the population of investors in a certain crypto asset. In order to produce this analysis we take every address with a positive balance of a particular token and estimate the average cost at which the address acquired those tokens. Then we organize addresses in clusters according to their average purchase cost, which we then compare to the current price of that crypto asset. This, in turn, allows us to see how many addresses would either make or lose money if they were to sell their tokens at the current moment in time.
Correspondingly, if the current price of the asset is higher than the average cost of the tokens being held on those addresses, it is said that they are “In the Money”. On the contrary, if the current price of the asset is less than the average cost of the assets being held, then those addresses are “Out of the Money”. Lastly, if the current price of the crypto asset is very close to the average price of the tokens being held, it is said that those addresses are “At the Money”. This allows us to identify real support and resistance bands created from real positions in millions of crypto-asset addresses.
What is the Large Transactions indicator?
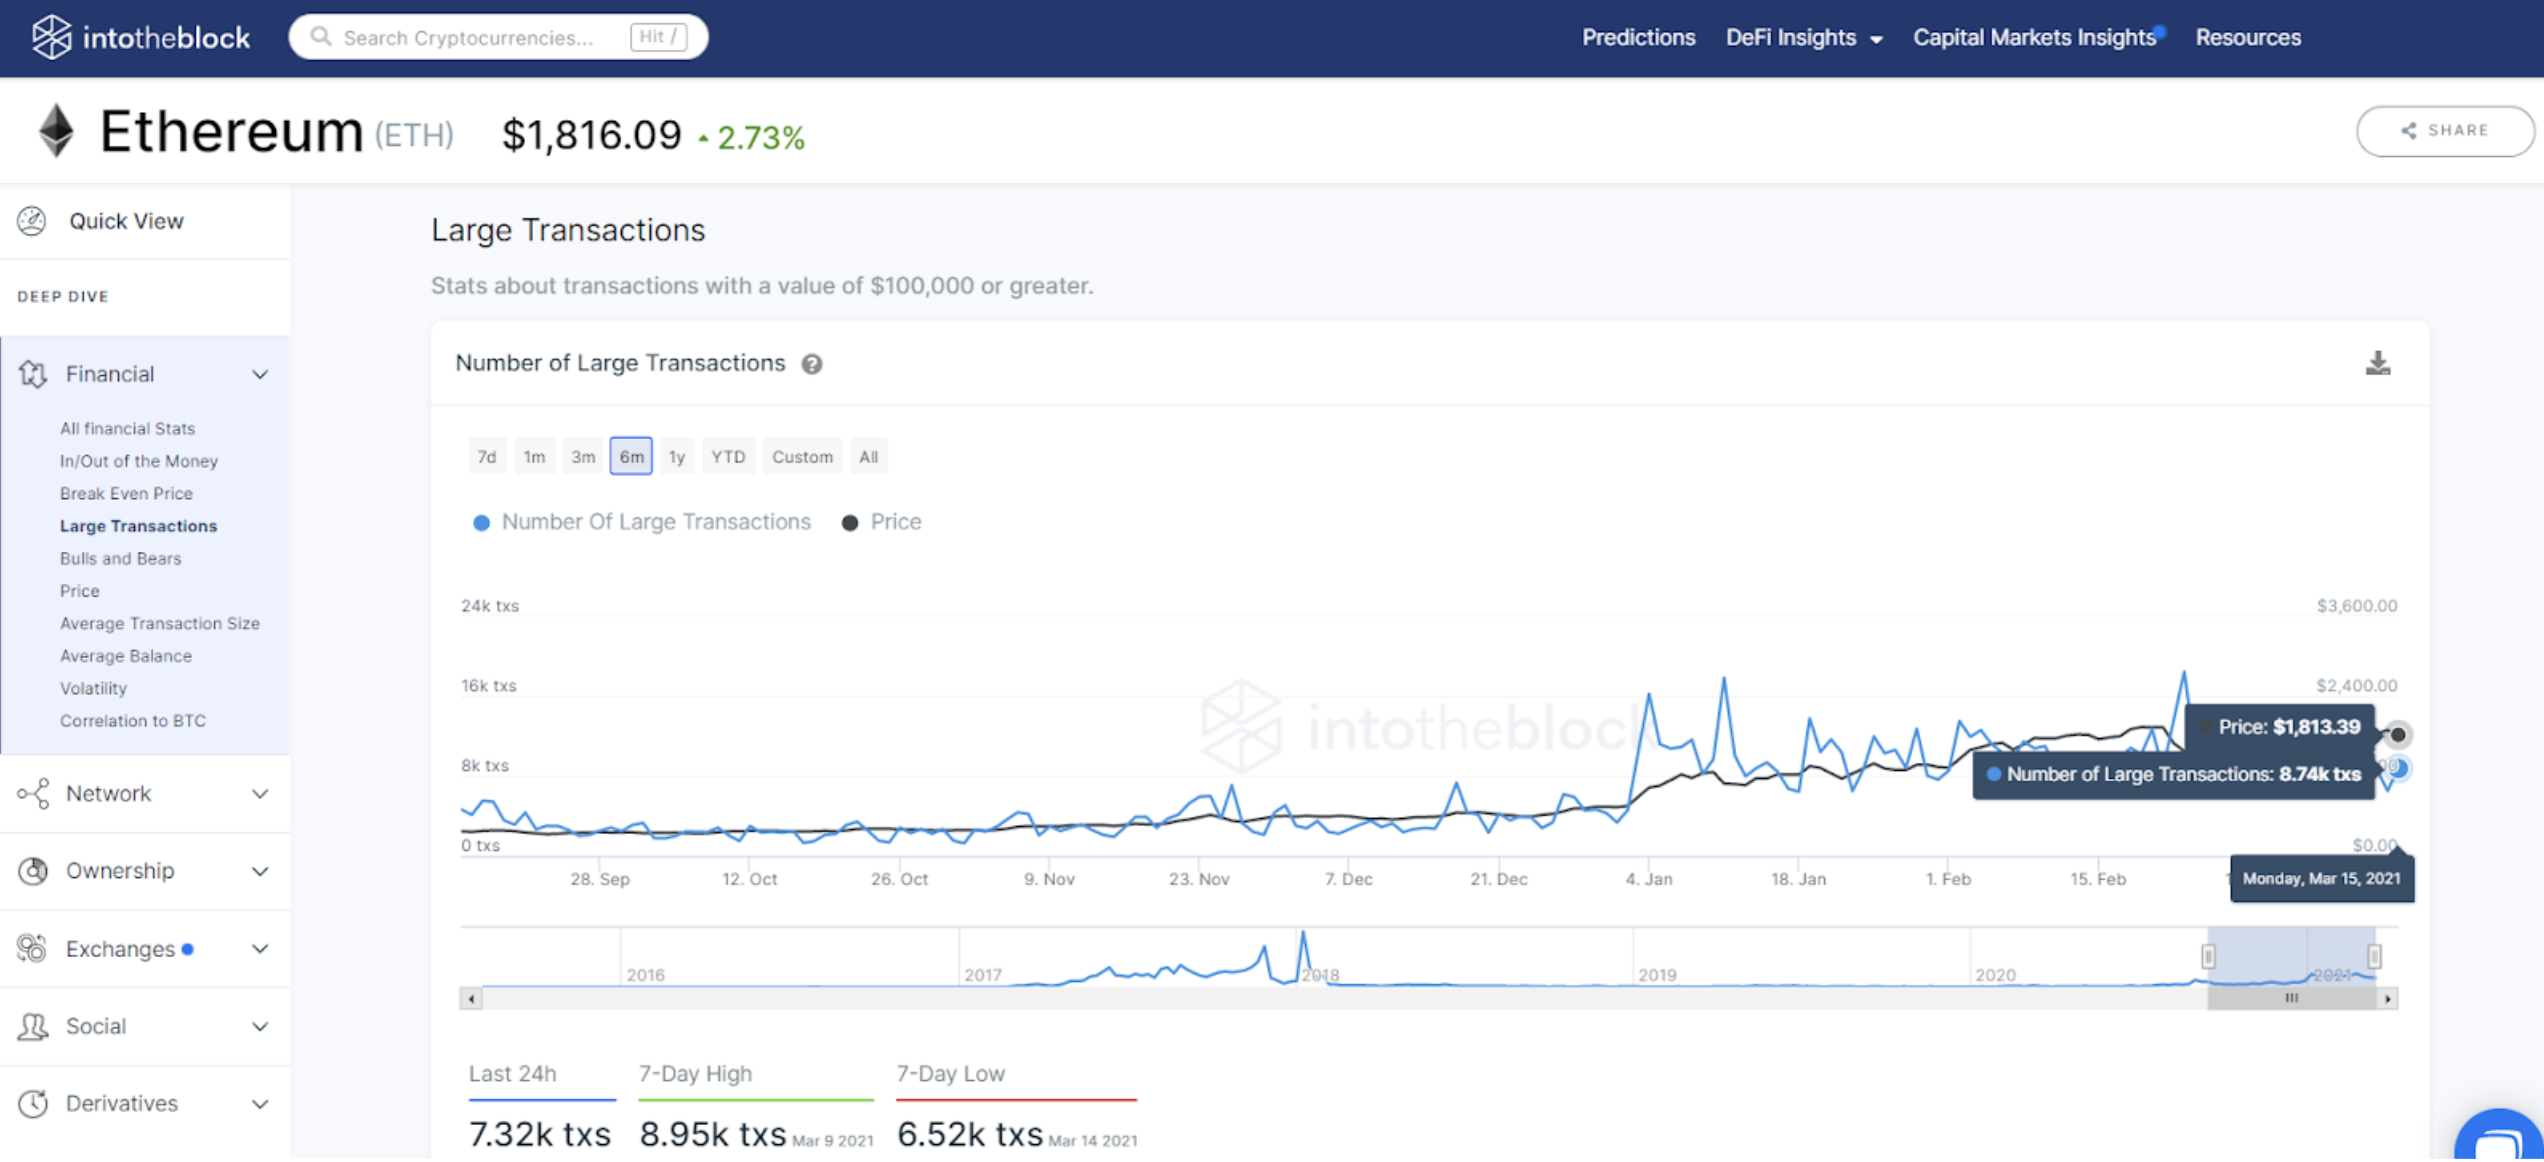
Francesco: The “Large Transactions” indicator accounts only for those transactions with a dollar value greater than $100k and we use this analysis as a good proxy for institutional activity within these networks. We have actually observed that this metric has a lot of correlation with price movements, which makes sense given the fact that crypto is still a relatively small market, an increased flow of institutional money can really move the needle.
What does the “Transactions Greater than 0K” indicator show?
Our “Transactions Greater than $100K” indicator filters and accounts only for on-chain transactions that surpass $100k in value, and therefore works as a good proxy for institutional investor activity within the network. As of today, one can observe that in the last 7 days there has been a total transaction volume of about $161.91 billion through these “large transactions”, and if we follow this metric through the time you will notice how it has increased dramatically over the past few months, indicating a rise in institutional adoption.
What is the East vs West Indicator?
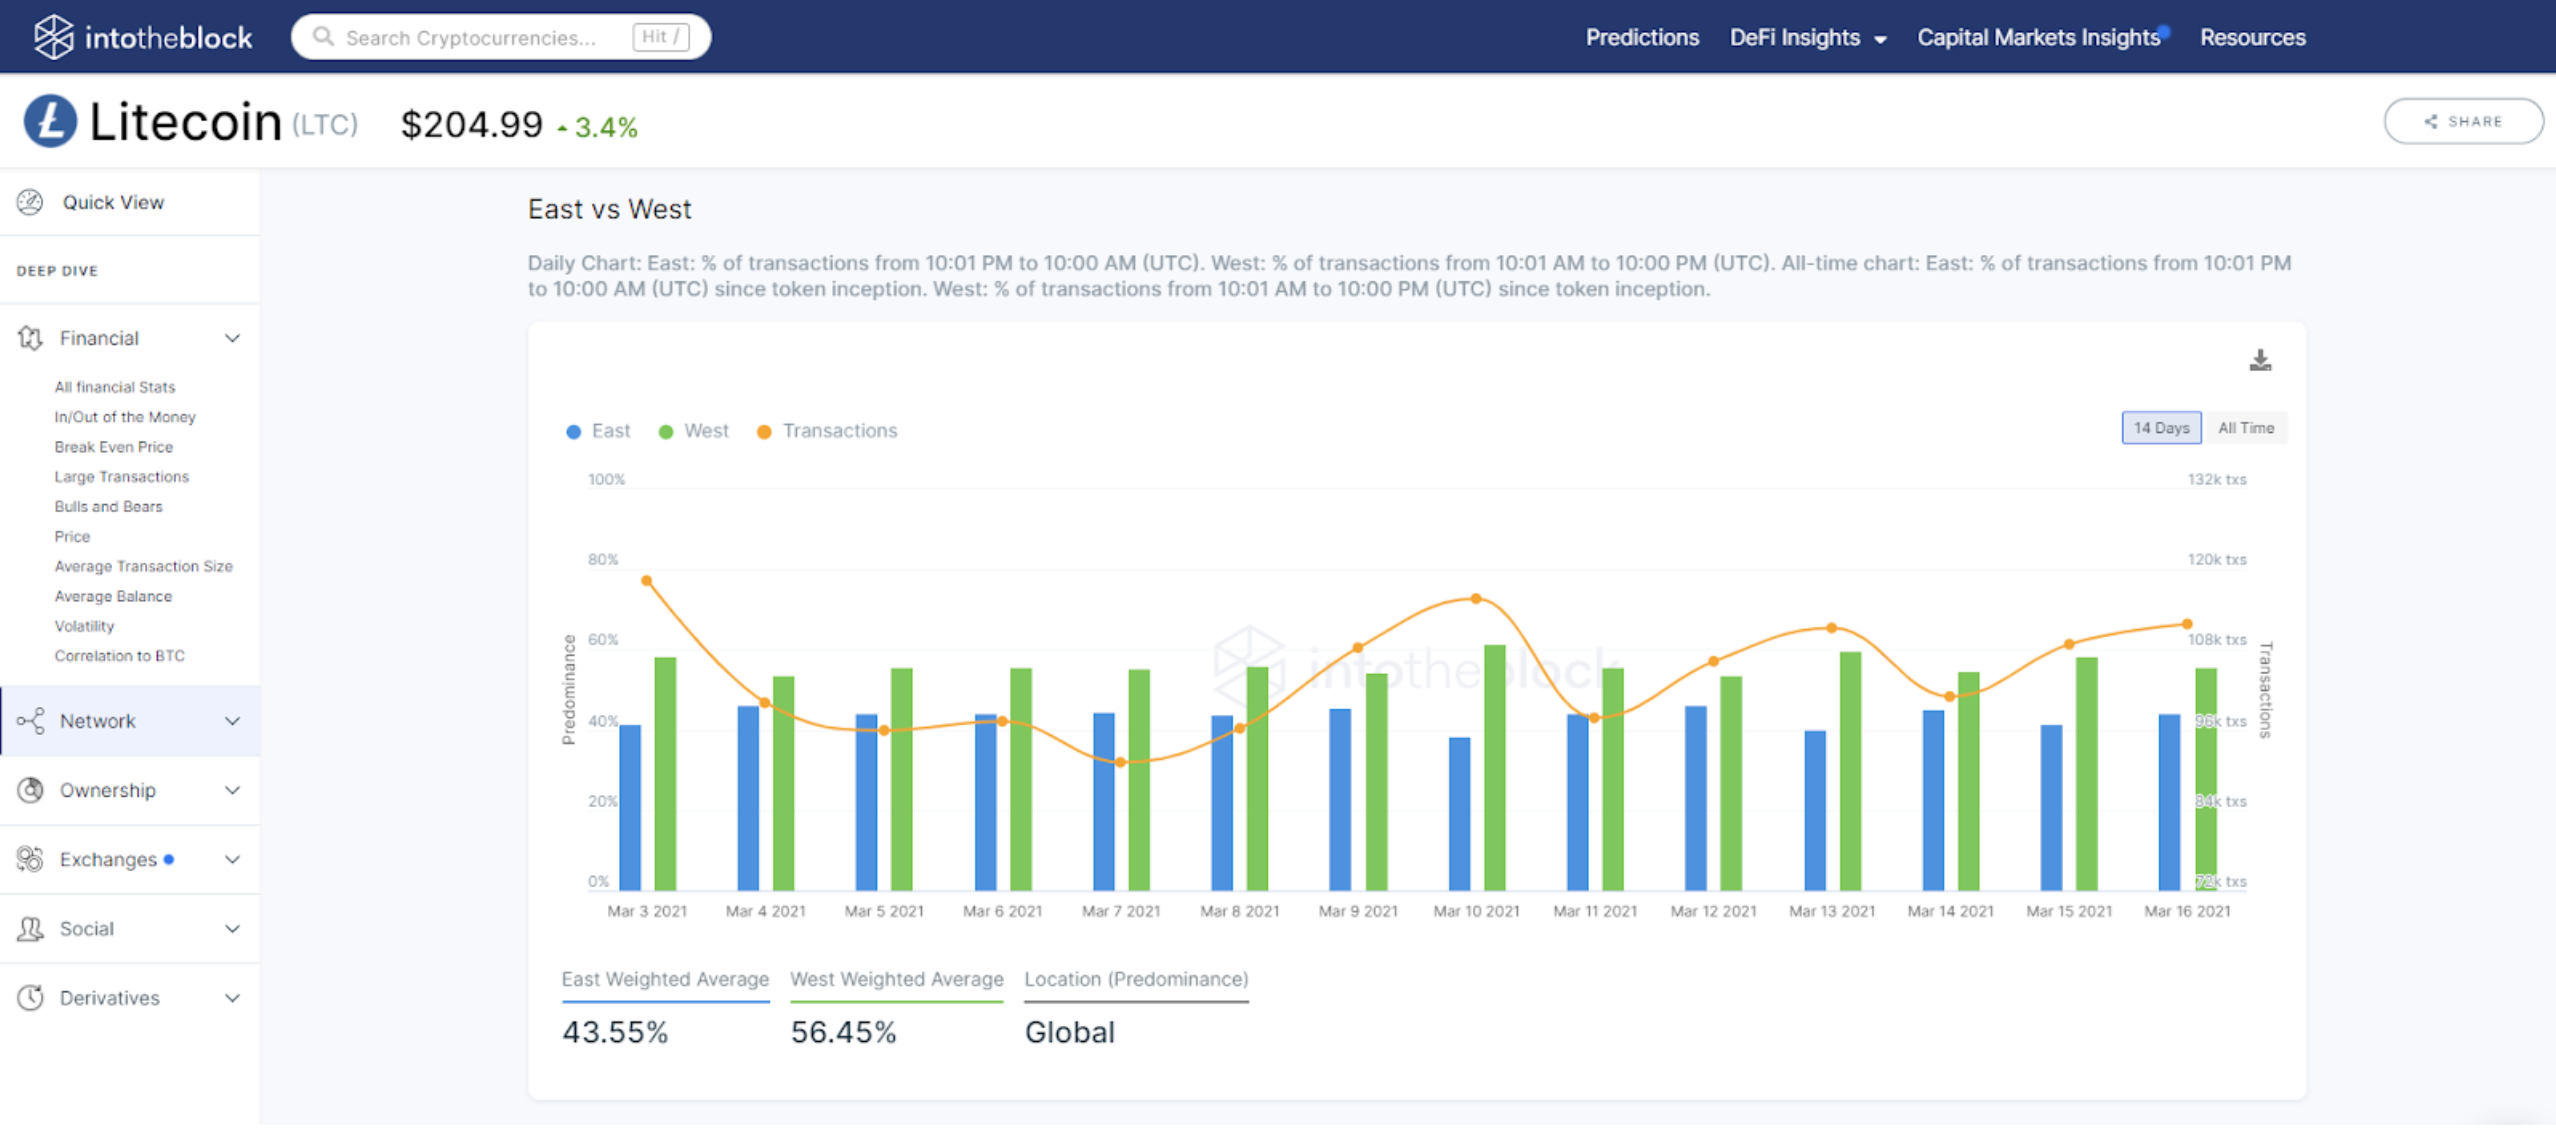
In terms of our network indicators, the “East vs West” is one of everyone’s favorites. Since crypto is 24/7 365 days a year, we had to come up with a more straightforward way of identifying where most of the activity in blockchains is taking place. For this, we divided the world into two hemispheres (East-West) and we account and compare for all transactions that take place in different time-zones, allowing us to weigh where most of the activity is taking place. For example, if a transaction is executed within either an American or European trading time-zone, it will be counted as a Western transaction. Similarly, if that transaction took place during an Asian trading time-zone, it will be accounted as an Eastern transaction.
Why is the East vs West indicator important?
Because it can enable our users to mitigate risk if they are located in a geography that is opposite to where their crypto-assets are having the most activity. For example, if someone in Asia is investing in Litecoin, they should be aware that the distribution of activity is usually disproportionately large towards the West side of the world.
If I were to be located in Hong Kong and I was trading or investing in, for example, Litecoin, I would never go to bed without setting a stop-loss or a take-profit order, since I would be more exposed to price variation either very late at night or very early in the morning.
Can this disproportion of increased activity be seen for all assets?
Nicolas: Yes, this indicator is available across all assets that the IntoTheBlock platform supports. Now, every asset is unique, and its distribution of activity may differ quite vastly. The Litecoin example shows the disadvantage it has for Eastern investors due to increased Western activity, but many other assets have a more favorable distribution for Eastern investors, such as Japanese crypto investors. In that case, the Western traders would have to be more cautious.
However, crypto-assets like Bitcoin and Ethereum tend to have a more evenly-distributed activity due to higher globalization qualities.
Are there price differences for assets between exchanges?
Nicolas: Most exchanges work with partners that supply liquidity to their order-books, but exchanges are also intertwined with one another, allowing them to pull liquidity when there is a need for it. This connection between market makers, liquidity providers, and exchanges usually will not allow for massive arbitrage. There might be slight price differences in not-so-known exchanges, but in principle, that is not true for large and international exchanges. For example, that’s why you don’t see large variations in price between Binance Asia, Huobi Global, and Binance US.
Is there more room for data aggregation, insights, and better intelligence?
There is absolutely more room for data aggregation, newer types of analytics, and better insights. Crypto is still a new and young type of industry, and we believe we have only scratched the tip of the iceberg. The ITB platform is our first take into this rabbit hole. We are continuously finding interesting things and creating more ways to understand and analyze the crypto-market, etc.
We believe we are creating significant value for crypto investors and that is why we are growing at a sustained pace. The more we dive deeper into these assets and use Machine Learning in large datasets, the more patterns we are going to find.
Blockchain is this magical creation that people have access to where the information is mostly publicly available, and we can leverage our creativity and tools to try to infer interesting things from the data. Most people do not realize that you cannot do the same with traditional financial assets where there are countless silos of information.
Interviewer , Editor : Lina Kamada
【Disclaimer】
The Article published on this our Homepage are only for the purpose of providing information. This is not intended as a solicitation for cryptocurrency trading. Also, this article is the author’s personal opinions, and this does not represent opinion for the Company BTCBOX co.,Ltd.