

Ki Young Ju is the head of CryptoQuant, a blockchain analysis firm that provides premium data for crypto hedge funds and traders. They are building blockchain metrics which this industry has never explored before and finding data that is highly relevant to professional traders. CryptoQuant started back in 2017. In the beginning, Ki Young Ju and his team tried to create anti-money laundering data and chainalysis. So, we were collecting address labels of exchanges, miners, whale wallets, illicit funds, etc., They have been very successful and are delivering data that tells what is happening in the crypto market.
Interview Date : 19th January 2021
- Ki Young Ju (All Interviews)
- How did you create CryptoQuant?
- How many exchanges does CryptoQuant support?
- What kind of indicators do you have?
- What determines the price?
- All-Exchange Inflow Mean Metric: What is Bitcoin Dumping?
- What ratio of Whales are on Exchanges?
- How can I know when to enter the market?
- What have miners to do with the price?
- What does the Korean Crypto Market look like ?
- What is the difference between Issuer’s Holding Coins versus Whales?
- How can we detect OTC trading?
- Why are Coinbase Outflows significant?
- How do recent Institutional Buys impact the market?
- How much Bitcoin do Exchanges have?
- What is Realized Capitalization?
Ki Young Ju (All Interviews)
How did you create CryptoQuant?
My dream was to become an entrepreneur. To become an entrepreneur I thought I had to have some experience in software engineering and business analysis. I thought that if I wanted to become an entrepreneur I cannot just continue as an employee; I need people to be the employer. I just started my company right after graduating from university and did projects and collaboration work with other companies. I worked for Penta security systems, one of the top cybersecurity companies in Asia, and I worked at the biggest Korean blockchain interchain project called ICON. However, due to the restrictions and almost non-existing market in Korea, I decided to make CryptoQuant an international place for everyone interested in the crypto market.
How many exchanges does CryptoQuant support?
CryptoQuant supports over 33 major exchanges, and at the end of this January 2020, we will have covered over 78 exchanges around the world including Chinese and Japanese exchanges. There is also a pro version of CryptoQuant that allows users to create their own unique version of TradingView, thus users can customize their own dashboard using our on-chain data. We support Bitcoin, ERC20 based stablecoins and ERC20 based altcoins, DeFi coins, Aave, Uniswap, Sushi, and many more.
What kind of indicators do you have?
We have many unique indicators using or on-chain data. For example, the Estimated Leverage Ratio shows all the derivatives exchanges’ open interest divided by their BTC reserve on that exchange. The value of this graph goes down, which is an indication that people are trading with low leverage. As you can see from the graph below, the estimated leverage ratio has decreased, meaning that people have opened their positions with low leverage. Leveraged trading is the use of borrowed funds with a contractually determined return to increase the ability of a business to invest and earn an expected higher return. A lower ratio of leverage means that companies operating or traders are generating enough revenue to grow their assets through profits.
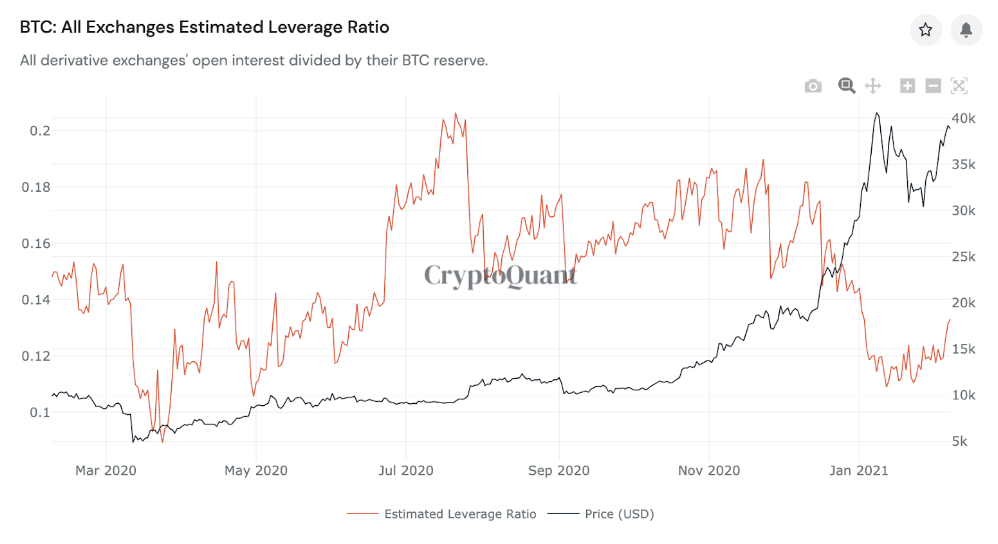
Conversely, if we have high leverage like we did in July 2020, it means there is uncertainty in the market, so it indicates leaving the market. Leverage ratios are quite related to market sentiments too. We have a lot of data showcasing people’s positions with respect to the market sentiment, and social data. This current low estimated leverage ratio tells us that people and corporations are here for the long term.
What determines the price?
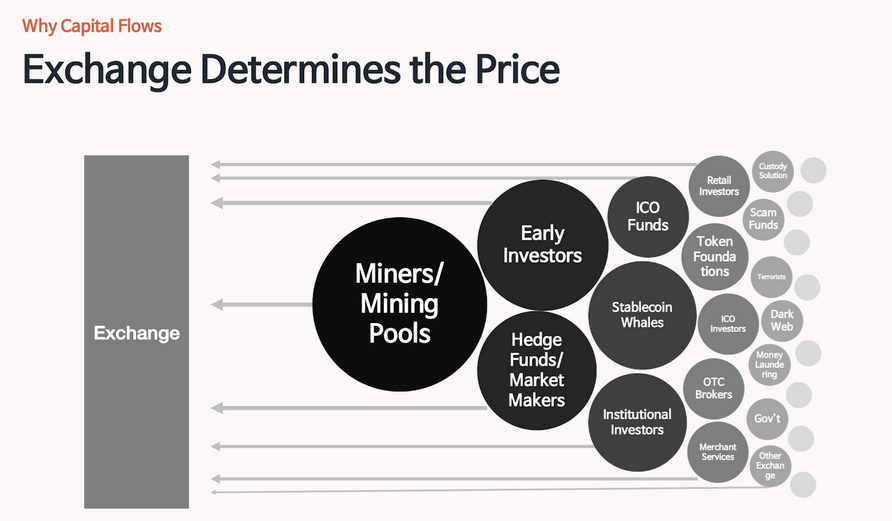
Exchanges determine the price. If you want to sell your Bitcoin, you have to send those Bitcoins to an exchange. Through on-chain data, anyone can confirm those transaction addresses. In our data analyses, we have miner addresses, early investors, hedge funds, market makers, stablecoin whales, and many more.
All-Exchange Inflow Mean Metric: What is Bitcoin Dumping?
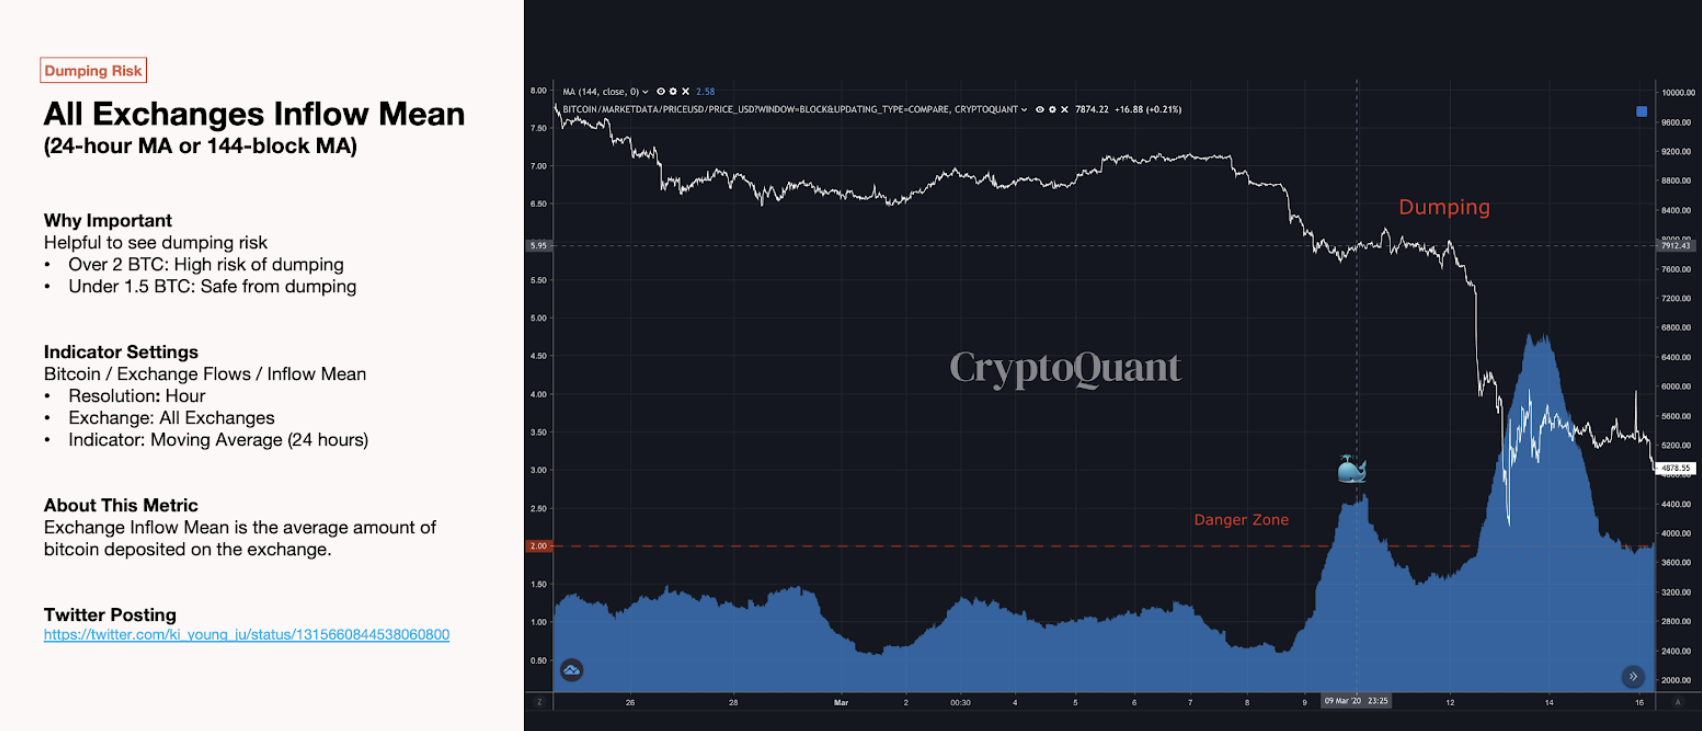
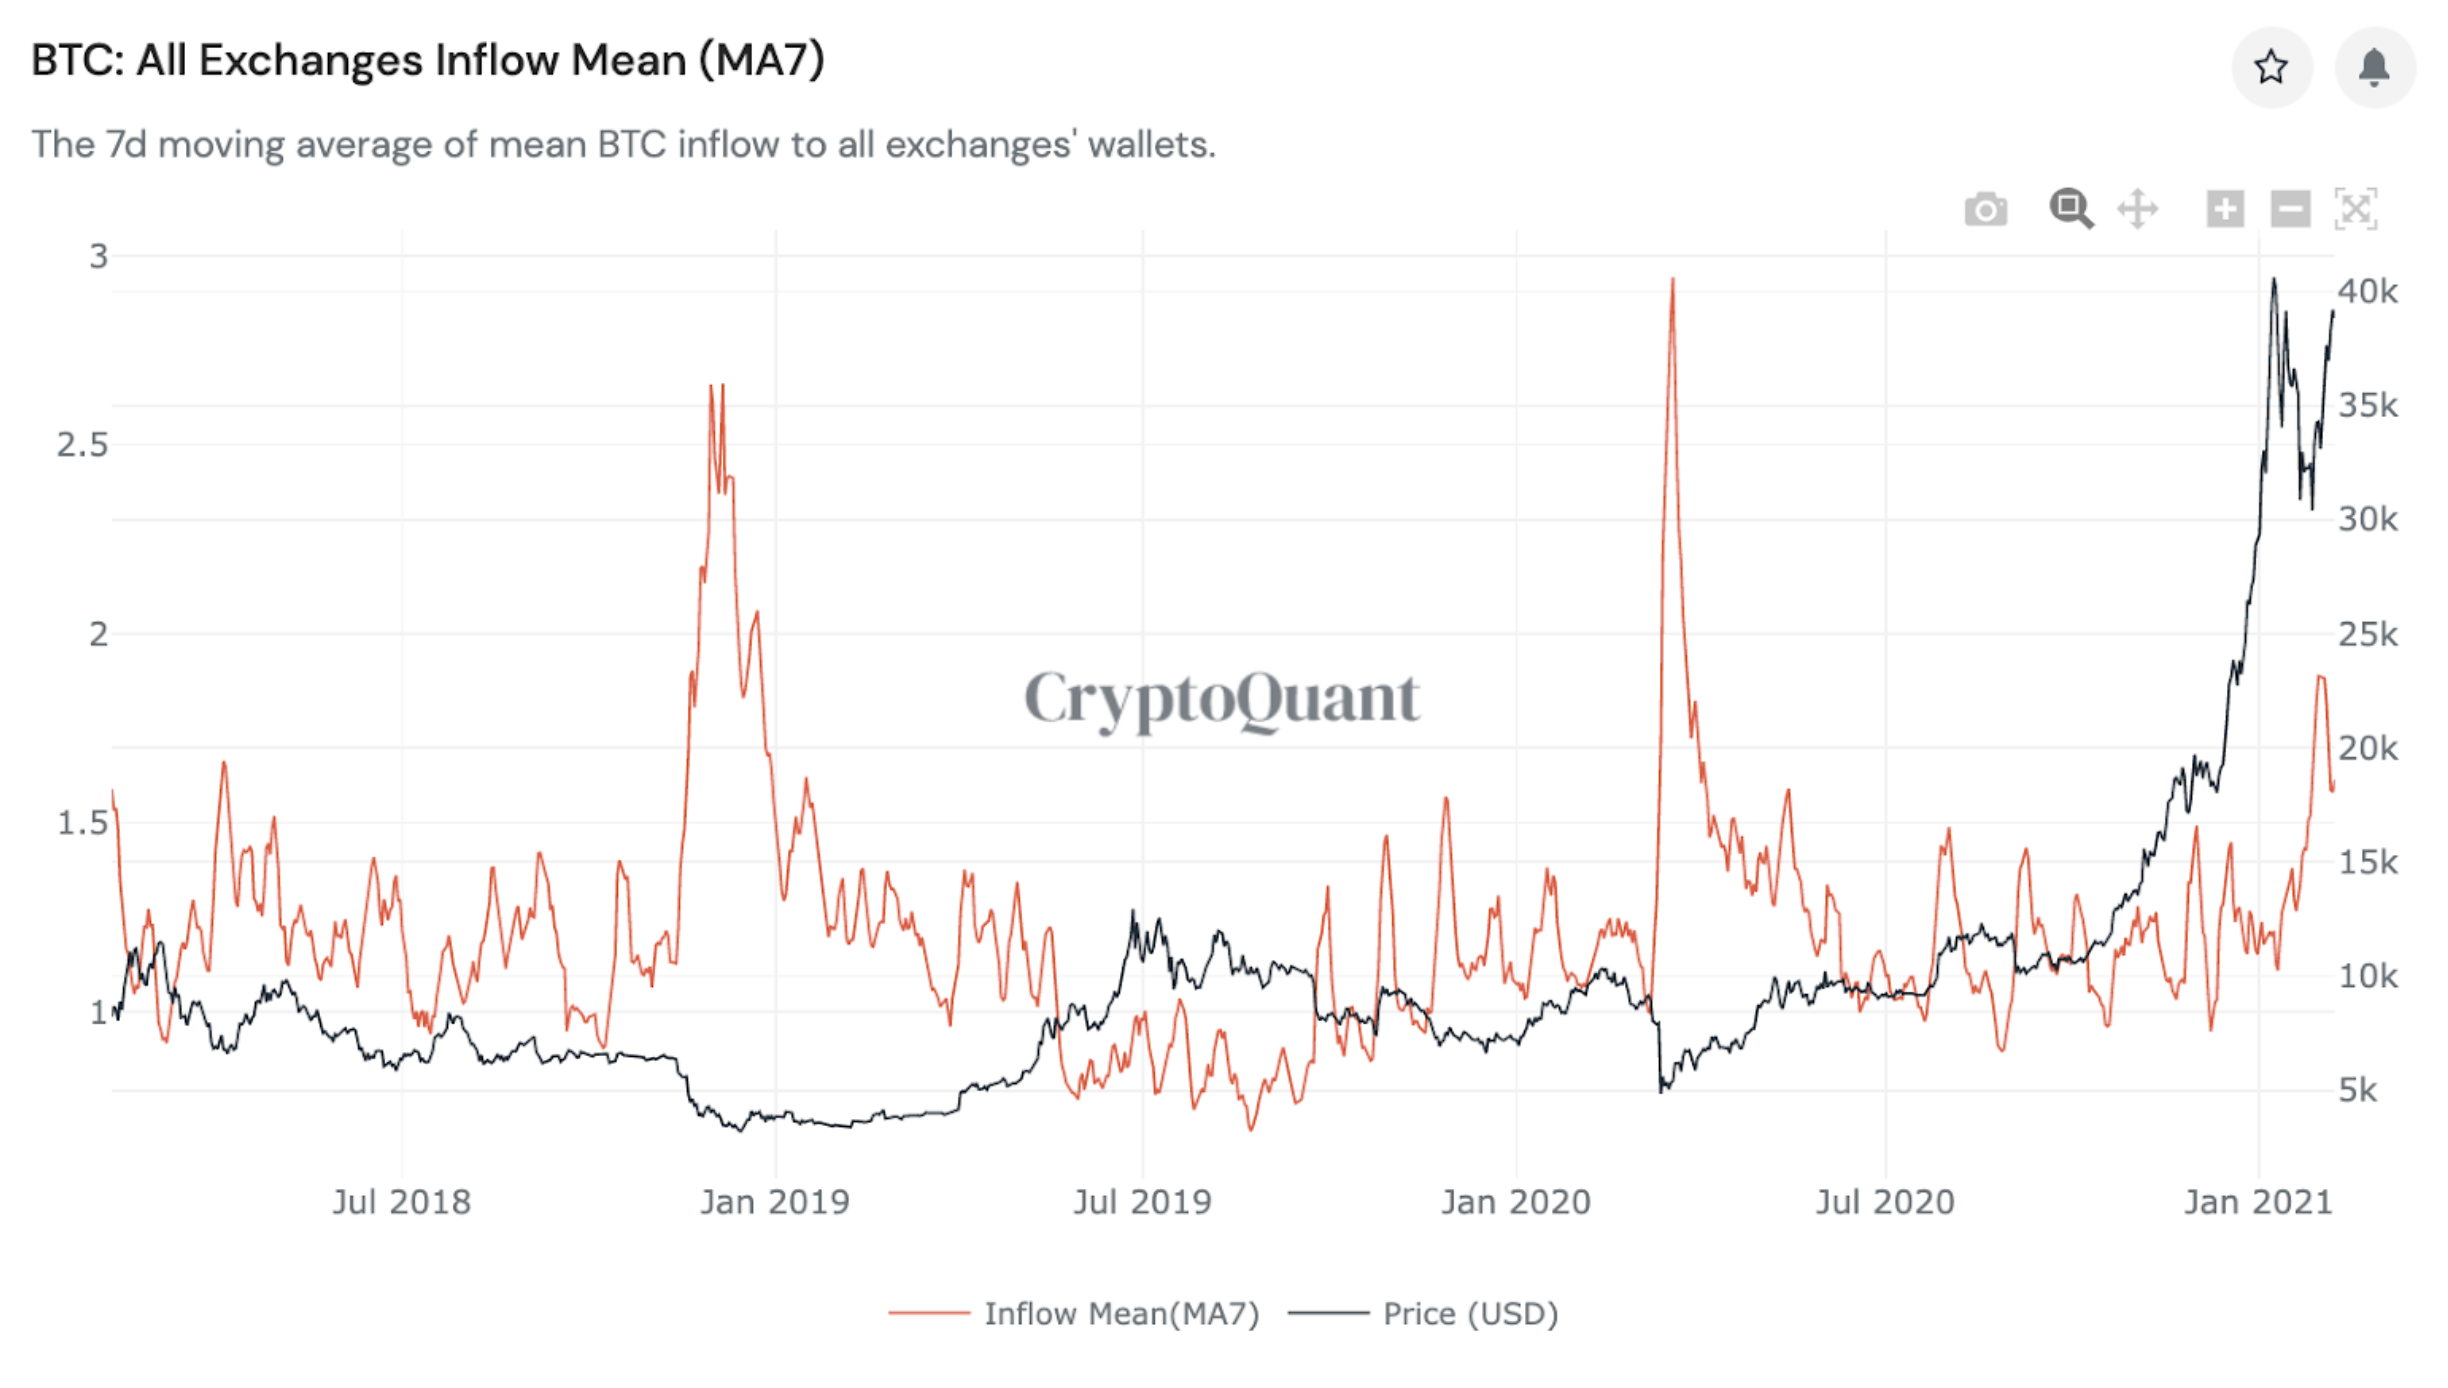
All these exchange inflows mean the average amount of Bitcoin deposited on the exchanges can be confirmed. It tells us about the risk factor that is mass coin dumping. The All-Exchanges Inflow Mean graph is a metric created to alert people of mass dumping. Through that graph, whenever the value of the metric goes above 2, it indicates that we are very active on the exchanges, and the price is likely to be bearish or move sideways from here on. This shows that mass dumping at this point is highly likely to happen.
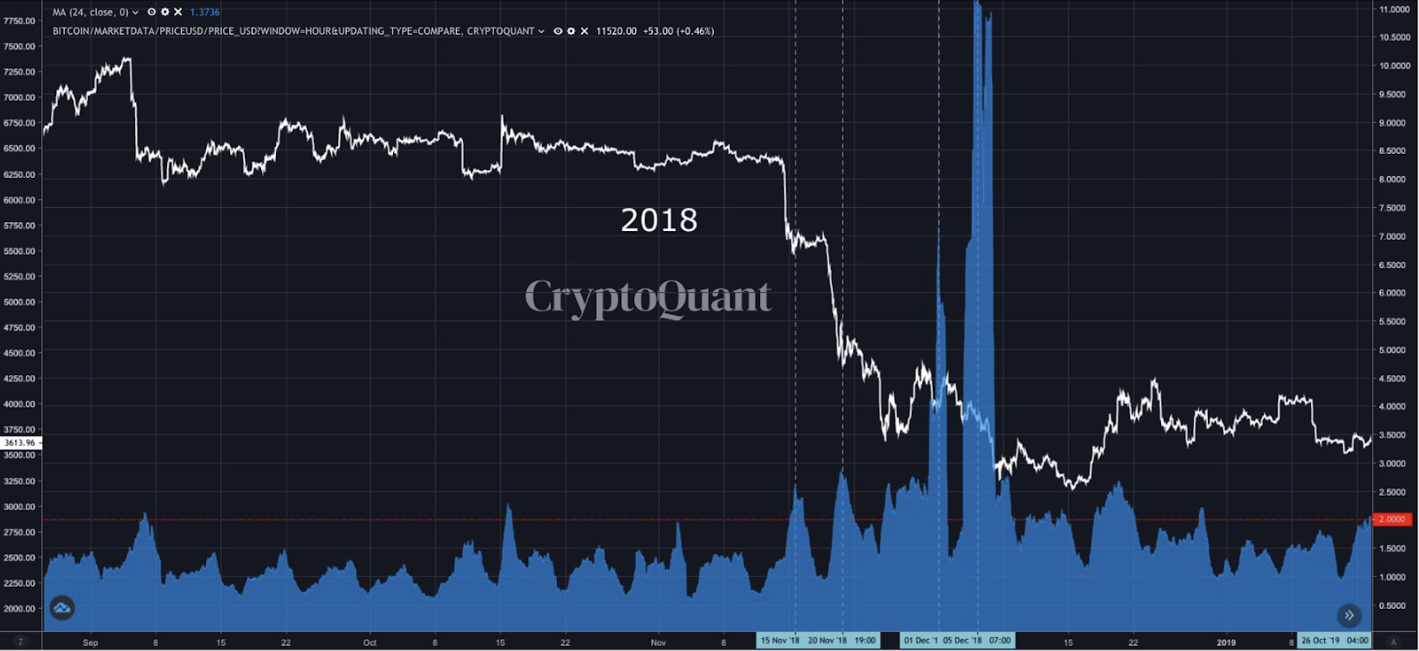
For example, looking at the data analysis from 2018, we can see a huge dumping of BTC was conducted in November. That was right at the time when the rally was skyrocketing.
In 2019, we had a bull market where the whales were not that active on exchanges, so there were no signs of mass dumping.
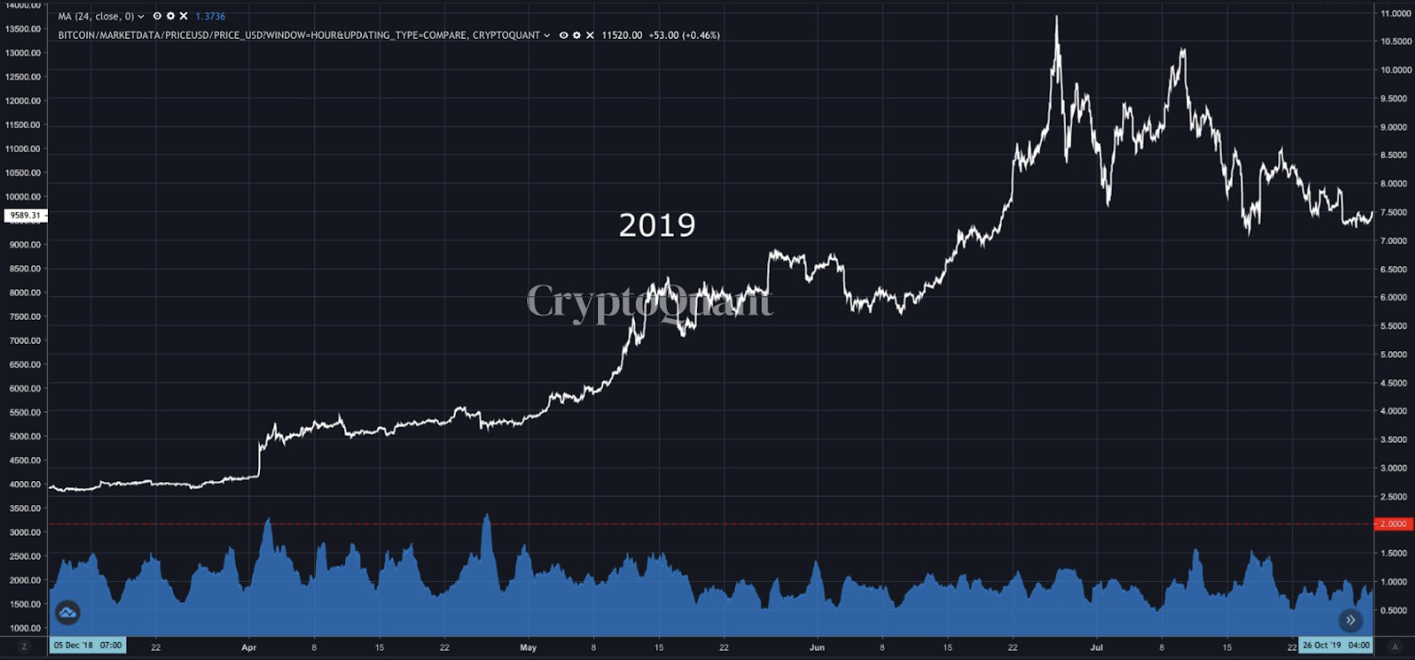
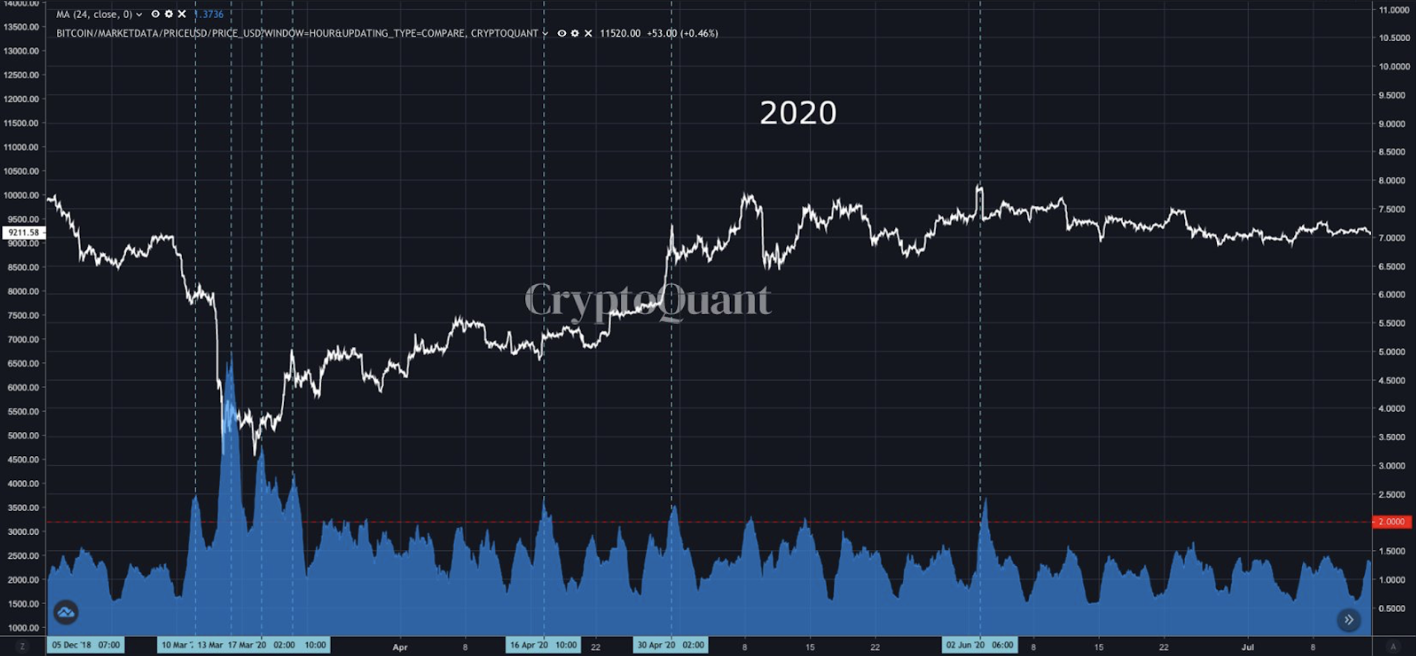
The 2019 trend ended in March 2020. As you can see below, there was a huge surge in March 2020 just when the price skyrocketed.
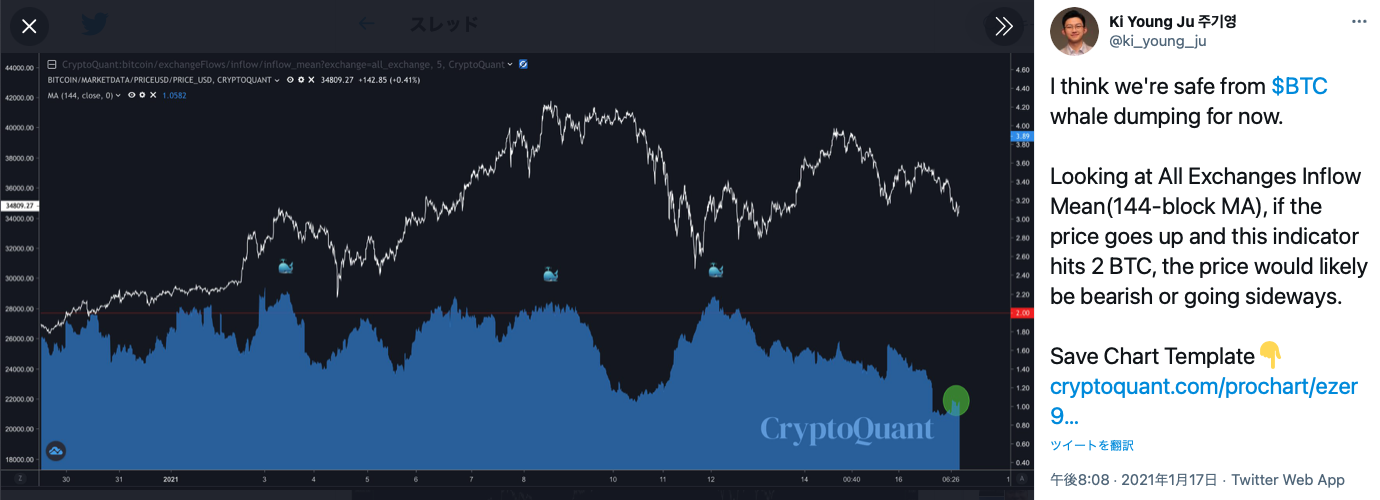
Currently, I believe we are safe from mass Bitcoin dumping. On January 17th, 2021, I posted the following metric on Twitter, and at that time the Bitcoin price was around 34 000 dollars which a few days later skyrocketed and hit 37 000 dollars. The value of the metric is below 2 and this index is showing that for the short term there will most probably be no mass dumping happening.
What ratio of Whales are on Exchanges?
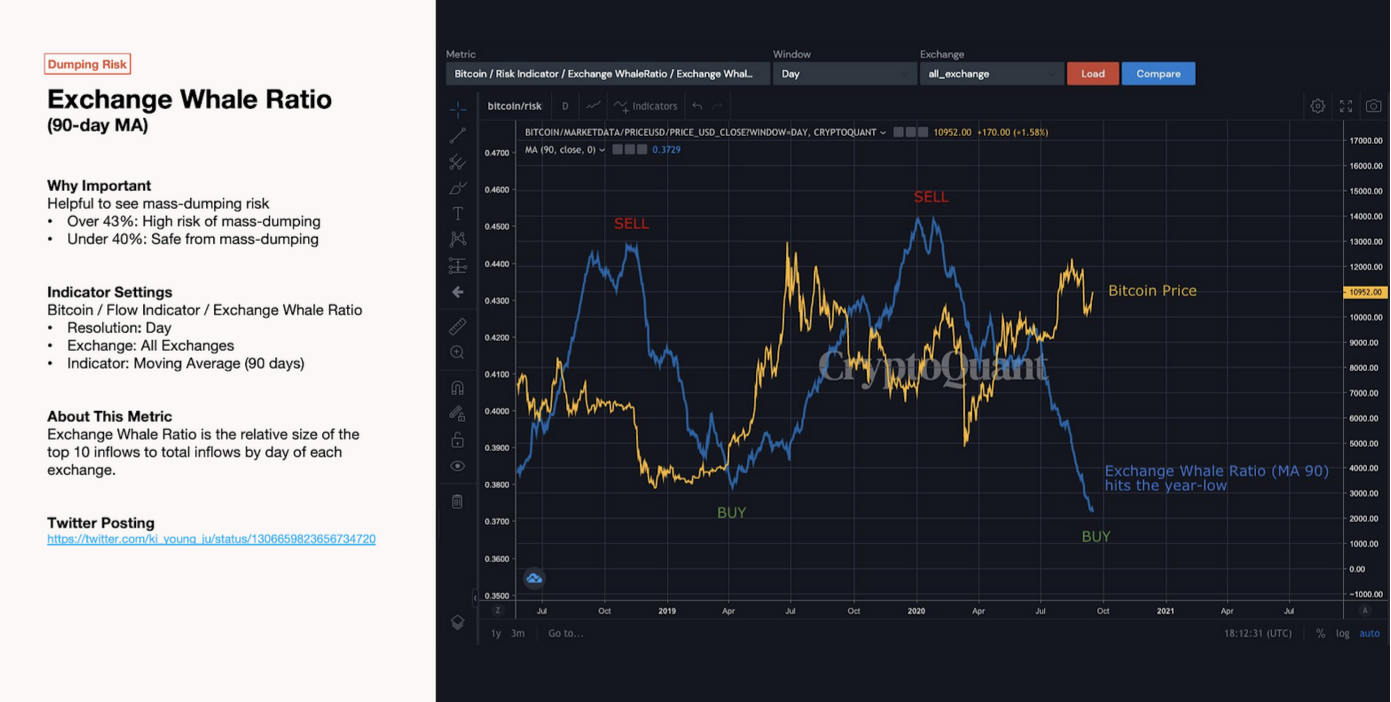
On the Exchange Whale Ratio graph, the top ten inflows are divided by the total inflows to calculate the ratio. We figured that when this value goes above 43%, mass dumping is likely to happen, and can be used to make an accurate prediction. This shows the activity rate of whales on exchanges, and whether or not they are conducting transactions.
How can I know when to enter the market?
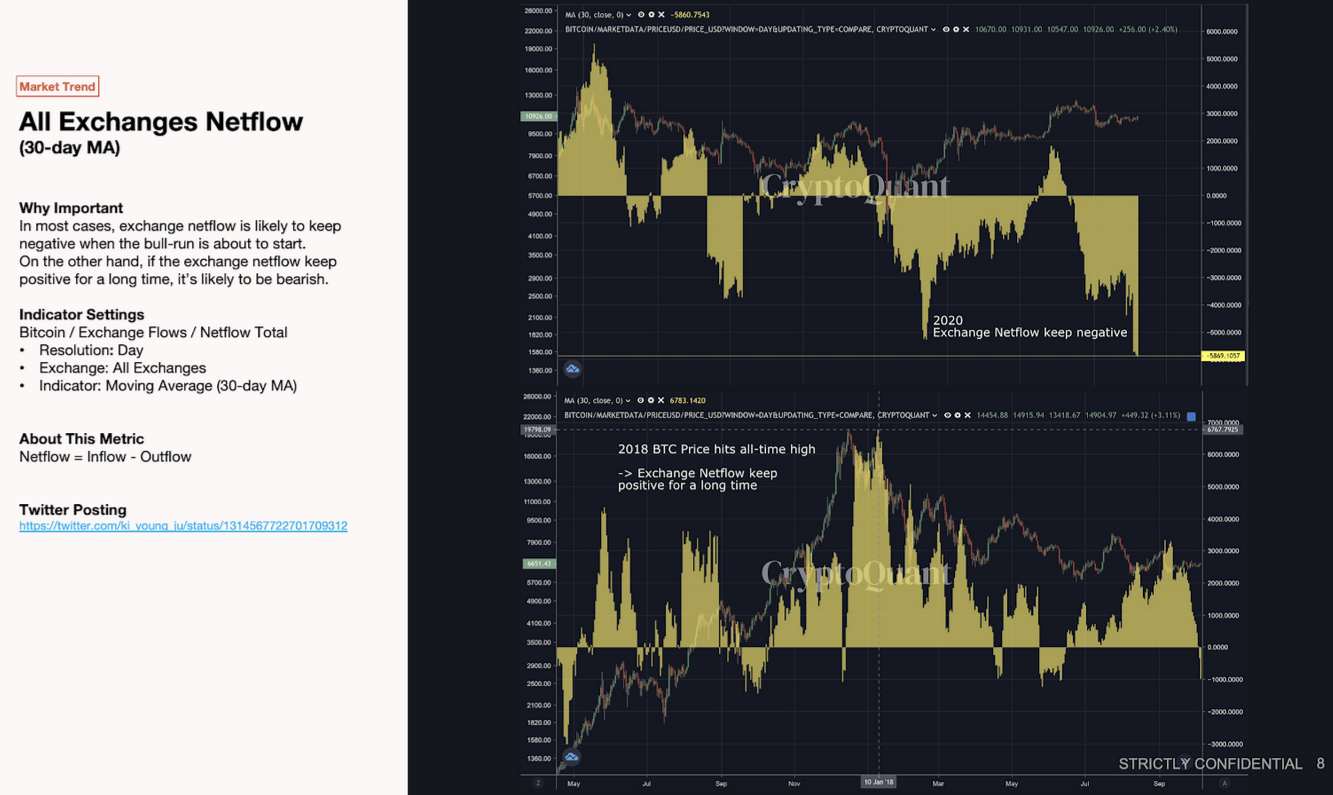
Through data analysis of all past events, we know that exchange NetFlow’s are likely to keep negative when a bull run is about to start. This is a great indicator that can show you when to buy and to find an entry point into the crypto space. Comparing the 2018 and 2020 graphs above, you can see that 2020 is a bull year as the metric is mostly showing negative. 2018 was the exact opposite of that, and that’s how we were able to confirm that year’s bear market.
What have miners to do with the price?
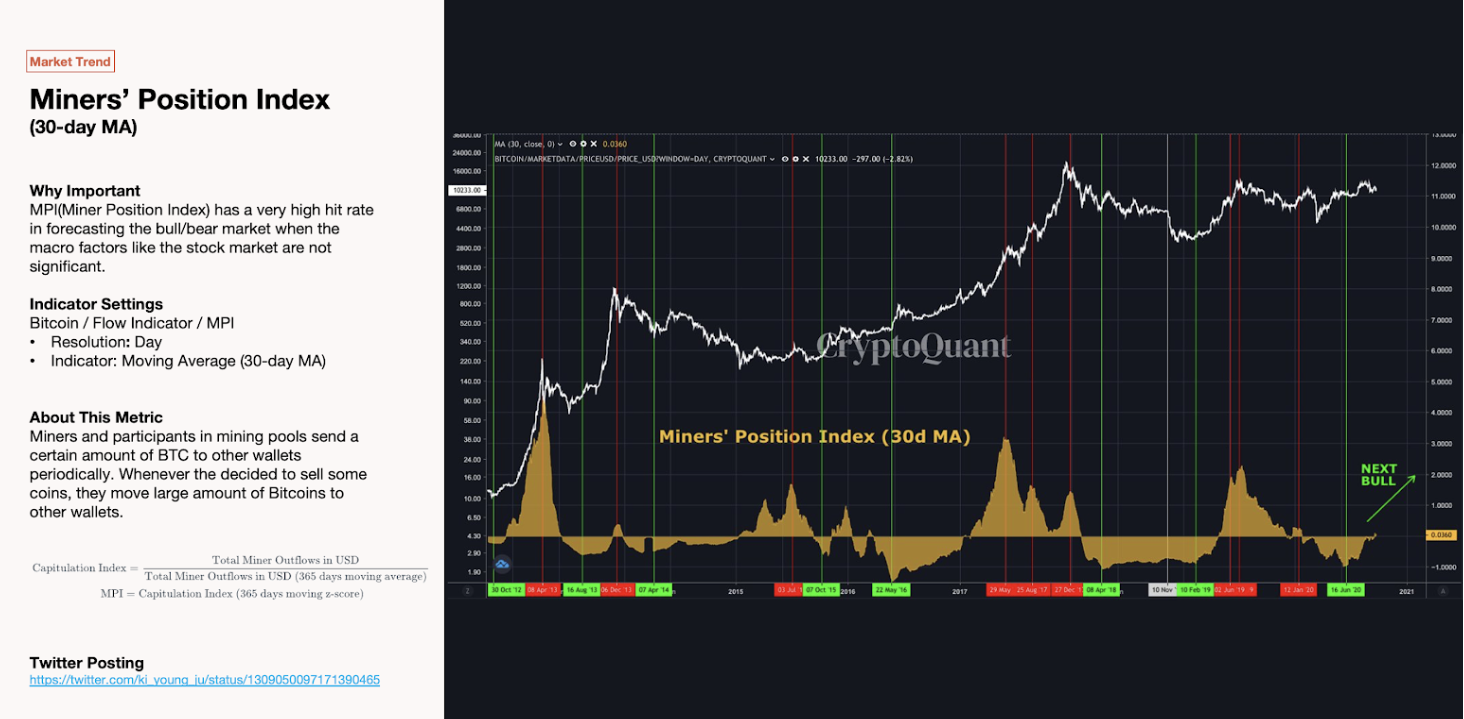
The Miners’ Position Index is one of our more unique indicators that shows periodic miner transfers of a certain amount of BTC to exchanges. Miner usually does not sell their Bitcoins nor capitulate them, but they do send a large number of assets to other wallets. And, whenever they do decide to sell some BTCs, they move large amounts of Bitcoins. This does have a very high hit rate in forecasting the next bull or bear market.
What does the Korean Crypto Market look like ?
Korea has some of the strictest regulations put on the crypto market compared to other countries. I think it will take quite some time for crypto companies to join institutional investments in Korea because the Korean government is blocking institutional investors from buying Bitcoin through regulation and bureaucracy. Even if you have a single Bitcoin, you are required to disclose that information to the Korean Financial Services Commission (FSC) which requires a lot of different kinds of licenses including ISMS. The Information Security Management System, in short ISMS, defines a stringent set of control requirements designed to help ensure that organizations in Korea consistently and securely protect their information assets. This sounds good for security but it doesn’t leave much room to breathe, and not to mention that the ISMS cybersecurity license costs around over 500,000 dollars.
Even though Korean corporations are bureaucratic and slow, retail investors are very innovative and open-minded when it comes to business. I think that this has to do with our upbringing from our parents who are encouraging us to take risks in order to gain something. Today, Korea is one of the fastest-growing countries in the world and many are looking for new opportunities. I hope that the crypto market will open more with this development.
What is the difference between Issuer’s Holding Coins versus Whales?
We know approximately what % of coins issuers hold it. A rather more infamous coin issuer who is going through a lawsuit currently, at one point held over 90% of his coins, before gradually dumping it. However, Bitcoin is completely decentralized, and its number of whales is increasing. The number of whales that have more than 1000 BTC is increasing, and this is positive for the overall market. Rather than only a couple of whales holding a massive amount of Bitcoin, now more people with large amounts of Bitcoin are emerging. I believe it is better to have 10 people who hold 1000 BTC each than 1 person holding 10 000 BTC. This reduces the risk of potentially dangerous market manipulation by a single massive whale. Now, as the number of whales is increasing, whales are becoming more normalized and thus their impact on the market impact is less dramatic.
How can we detect OTC trading?
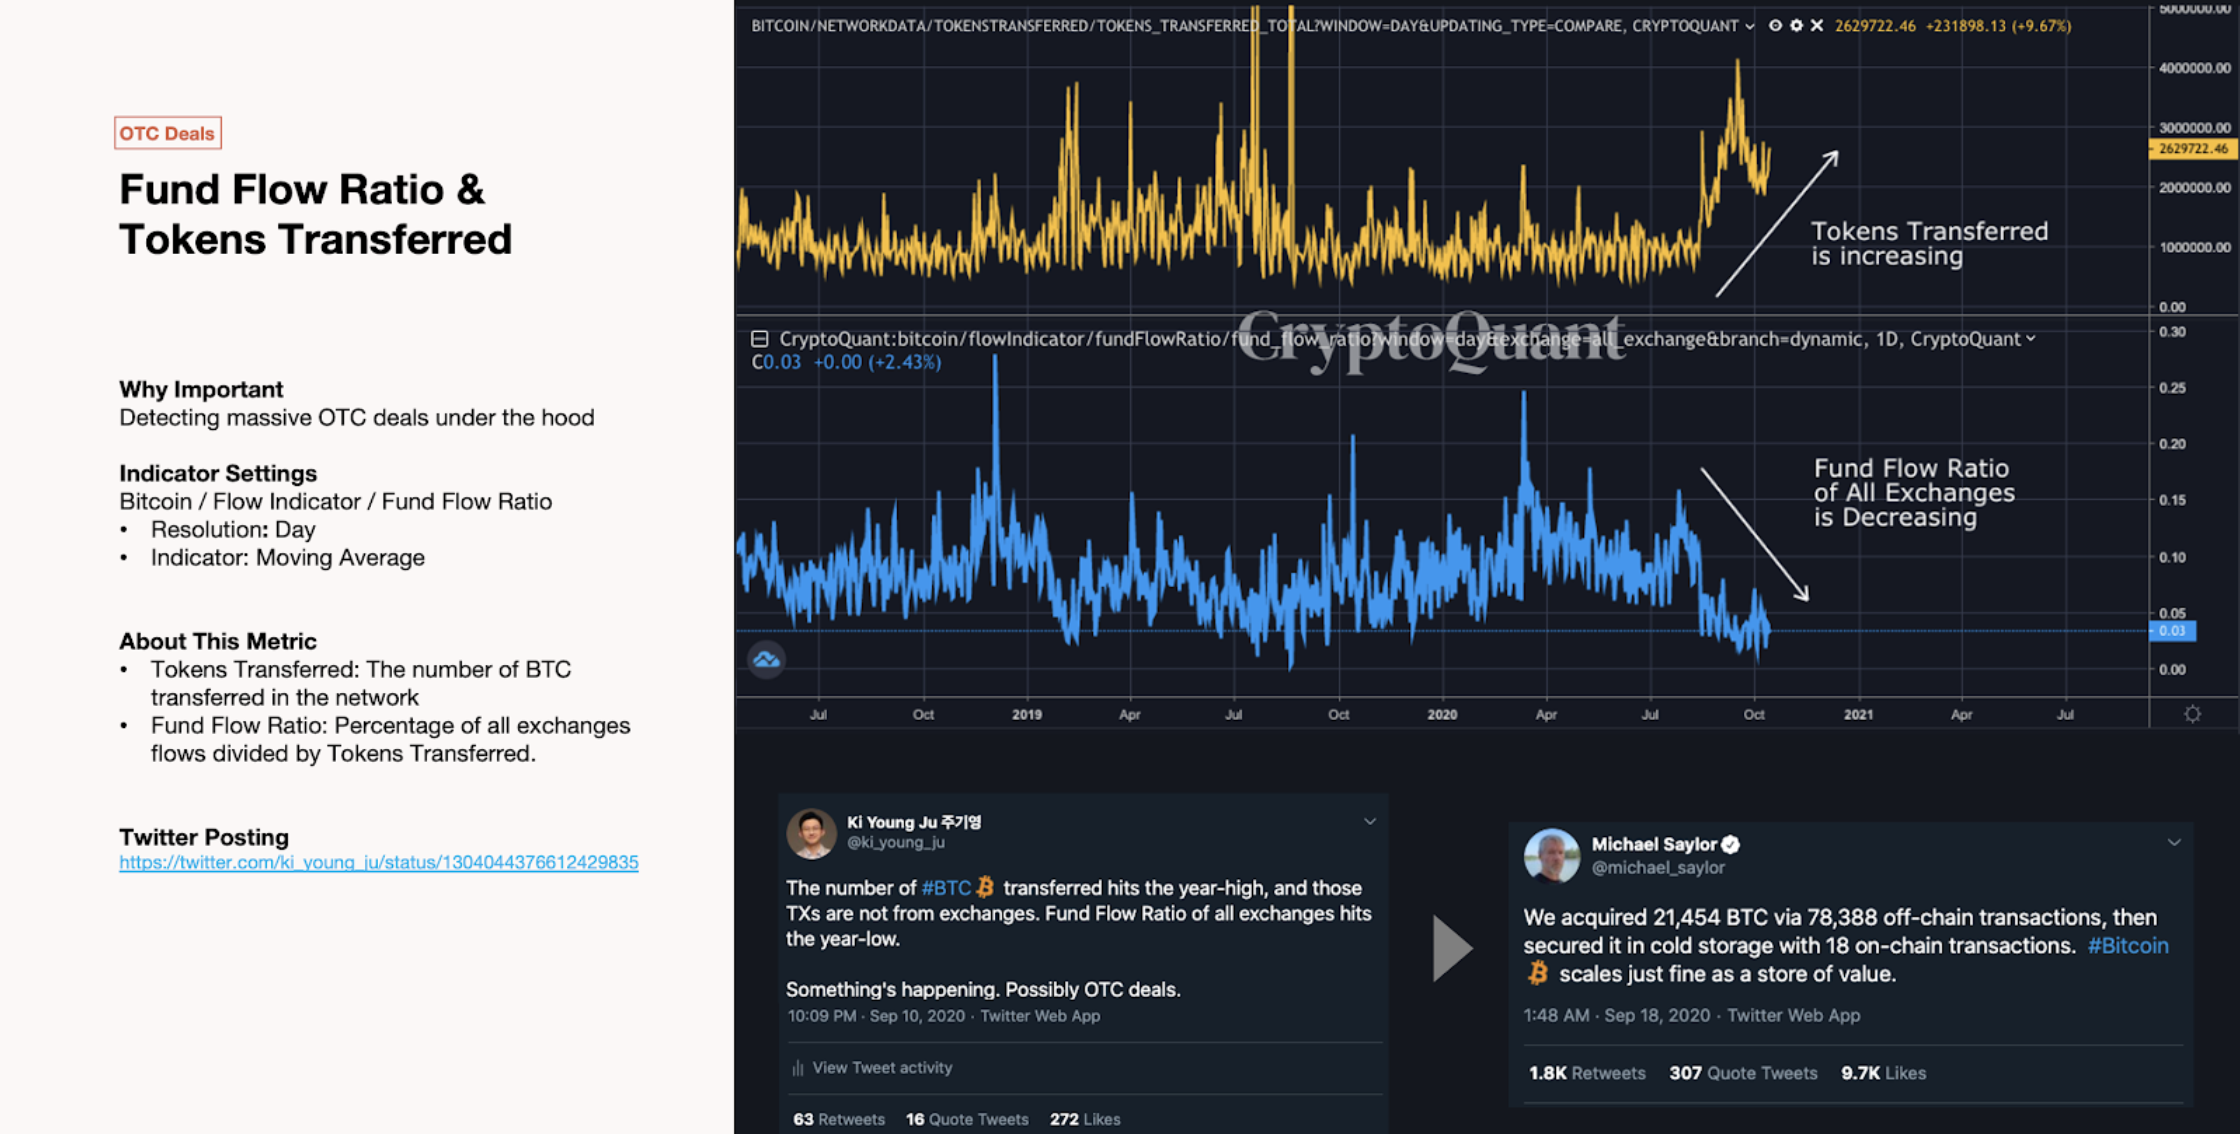
The Fund Flow Ratio & Token Transferred this another unique indicator by CryptoQuant. This is especially important for detecting Over-The-Counter (OTC) trading that is not on-chain. The percentage of all exchange flows is divided by tokens transferred, where tokens transferred is the number of Bitcoins transferred in the network. When this value of tokens transfers is increasing, it indicates that the fund flow ratio for all exchanges is decreasing. As you can see in the above graph, only 3% of token transfers are used for user deposits and withdrawals. Thus, 97% of token transfers were conducted off-chain outside of exchanges. I noticed the year-low exchange transfers versus the years-high transfer hits of 2020 and forecasted that a lot of OTC deals are happening. I posted about that on Twitter on September 10th, 2020, and 8 days later Michael Saylor had acquired 21,454 BTCs via an off-chain transaction. Only because we think that we do have everything recorded on blockchains, does not mean off-chain transfers are not happening. So being aware of such moves in space is something very important.
Why are Coinbase Outflows significant?
Another indicator to see OTC deals is Coinbase outflow. Whenever Greyscale buys some Bitcoin, they use Genesis trading to purchase. Genesis trading uses Coinbase OTC and Coinbase pro for buying Bitcoin. So, Coinbase OTC is directly integrated with Coinbase custody, and Coinbase Custody is directly integrated with Coinbase Pro wallet. They use the same management systems, so whenever Coinbase outflows happen, it goes to their custody wallets. Coinbase wallet apparently has 1000-8000 Bitcoins which is known through on-chain data.
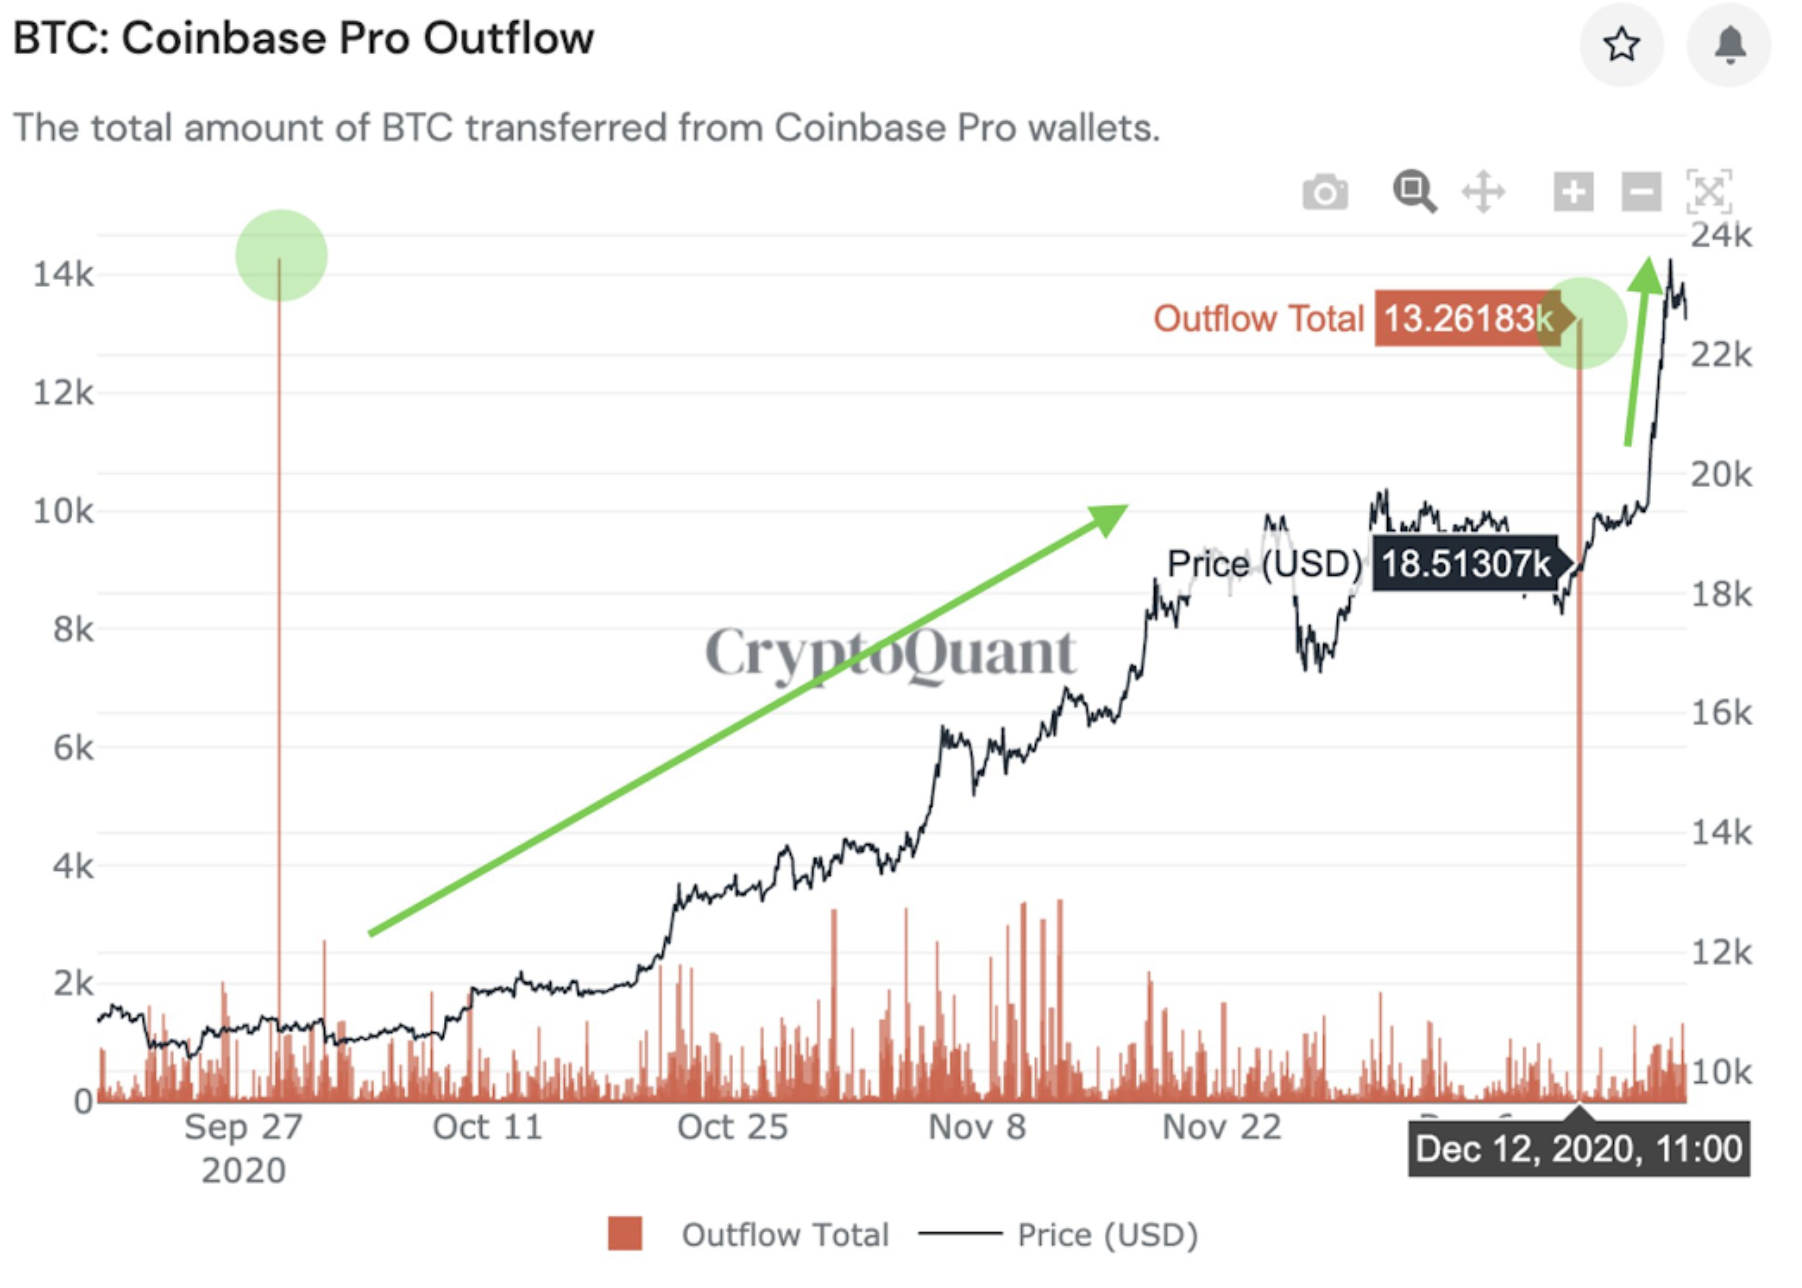
However, 12,006 Bitcoins flowed out of Coinbase. When I checked out all the wallets, I saw it all goes to custody wallets like the following:
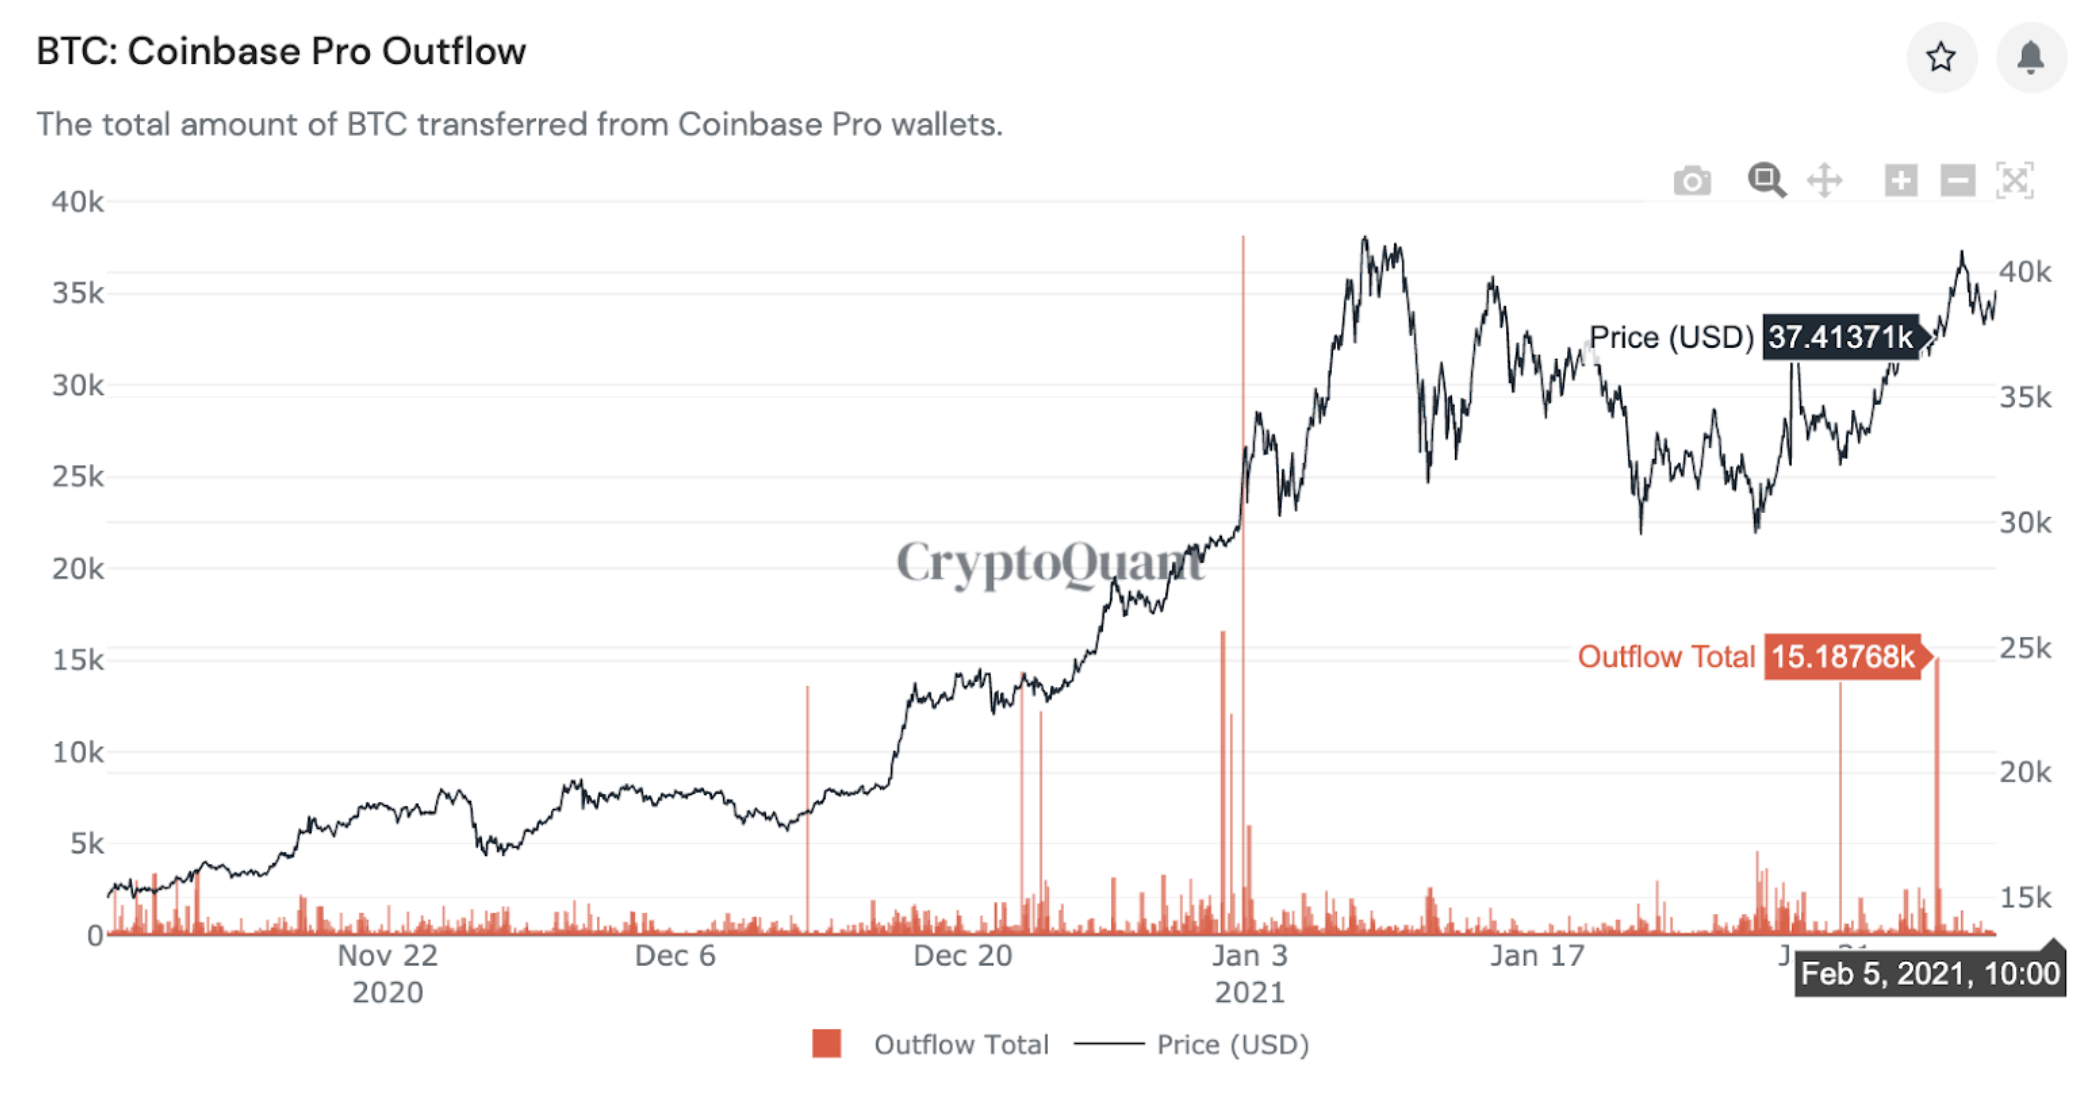
Coinbase has only inflows when you look at their on-chain data and no indication of outgoing transactions. So, those custody wallets, I assume, are conducting transfers through genesis trading. I assume that Coinbase is creating a new cold wallet for each customer after an OTC deal is made for institutions, and those BTC go to a custody-like wallet. The reason we are able to see these OTC trends and data is that Coinbase custody and OTC deals are integrated into one single service. We don’t know exactly how they do off-chain transactions but it is clear that every time there is a Coinbase outflow of Bitcoin, the price goes up as you can confirm in the graph below:
How do recent Institutional Buys impact the market?
Institutions are buying and coming to space usually when the price is at the bottom, just like in December of 2018, and that was around the time Coinbase OTC services opened. There was a series of institutional purchases, like July 2020, which is one of many such events that has led to the bull run we have today. Some people might say that this is just a coincidence, but we have checked all those transactions on Coinbase, and all that money went to their custody wallets.
I think this is an alpha for the market and we have to try to track all on- and off-chain data as much as we can. Thus, it is super healthy for the market that investors and corporations are coming into space.
How much Bitcoin do Exchanges have?
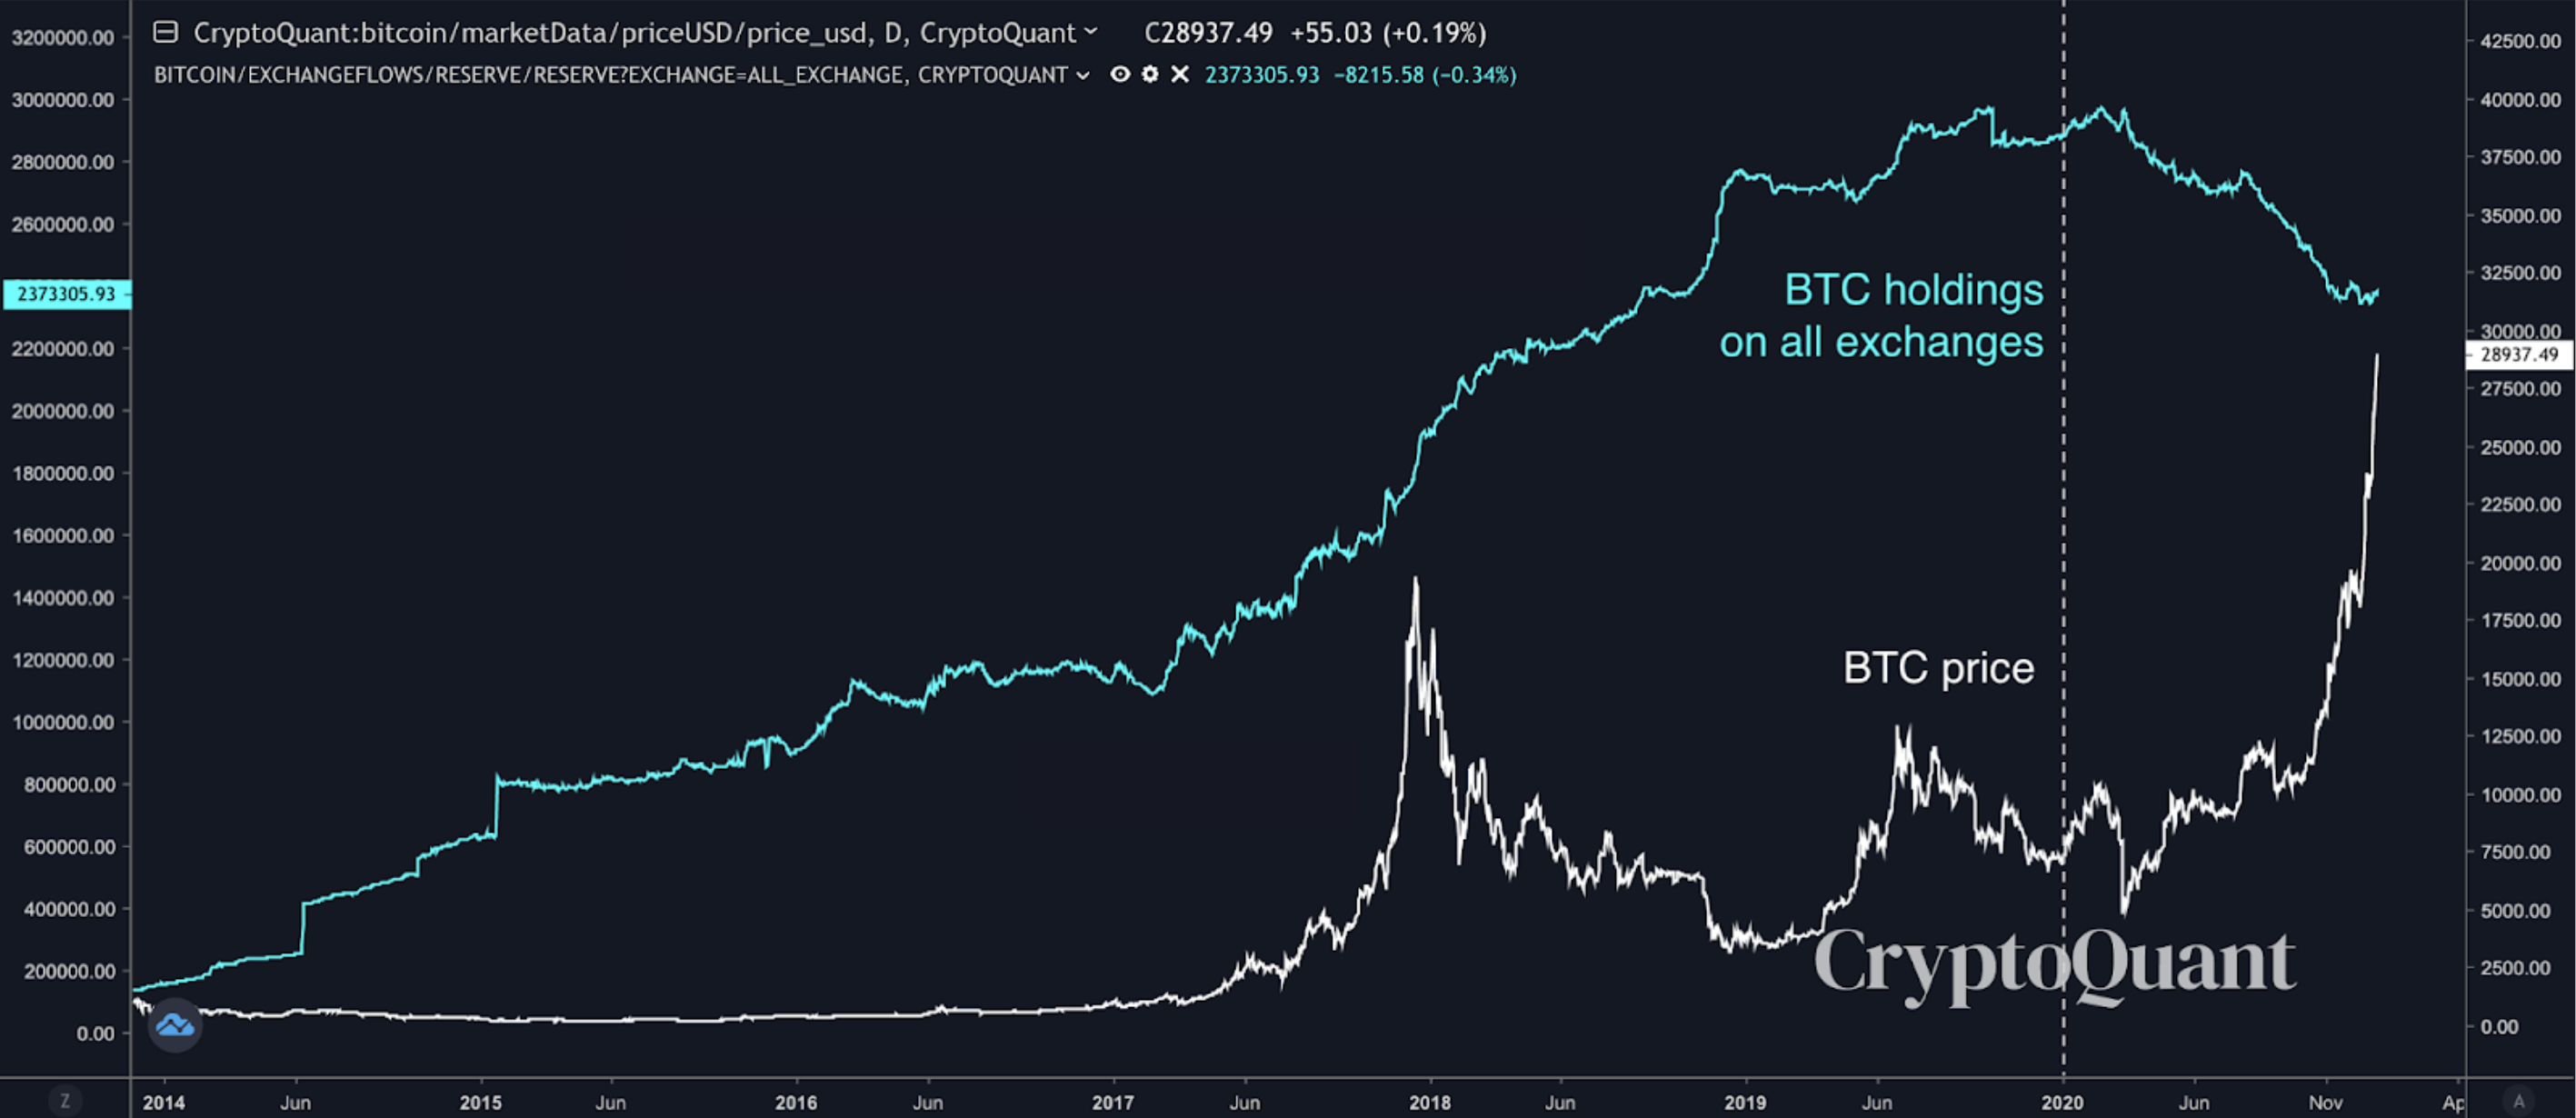
The above chart is a full history of exchange reserves (the blue line) from the time Bitcoin was created until February 2020. You can see that the exchange reserve has always been increasing, but since March 2020 it started to fall. That was a point where exchange reserves were decreasing for the first time. This means that we are having a liquidity crunch: there is a shortage in supply but very high demand leading to businesses and consumers being charged high-interest rates. If this continues, there will be no Bitcoins available for purchases. Right now, this is a trend that not only institutional investors but private individuals are more inclined to hold their Bitcoin rather than selling it. I don’t think that investors are harming the market for individuals because they are emerging as most of them are thinking of their investment as a long-term one.
What is Realized Capitalization?
Realized capitalization is the capitalization gains of an investment. We confirmed realized capital gains by looking at all the UTXO’s that had moved on the blockchain.
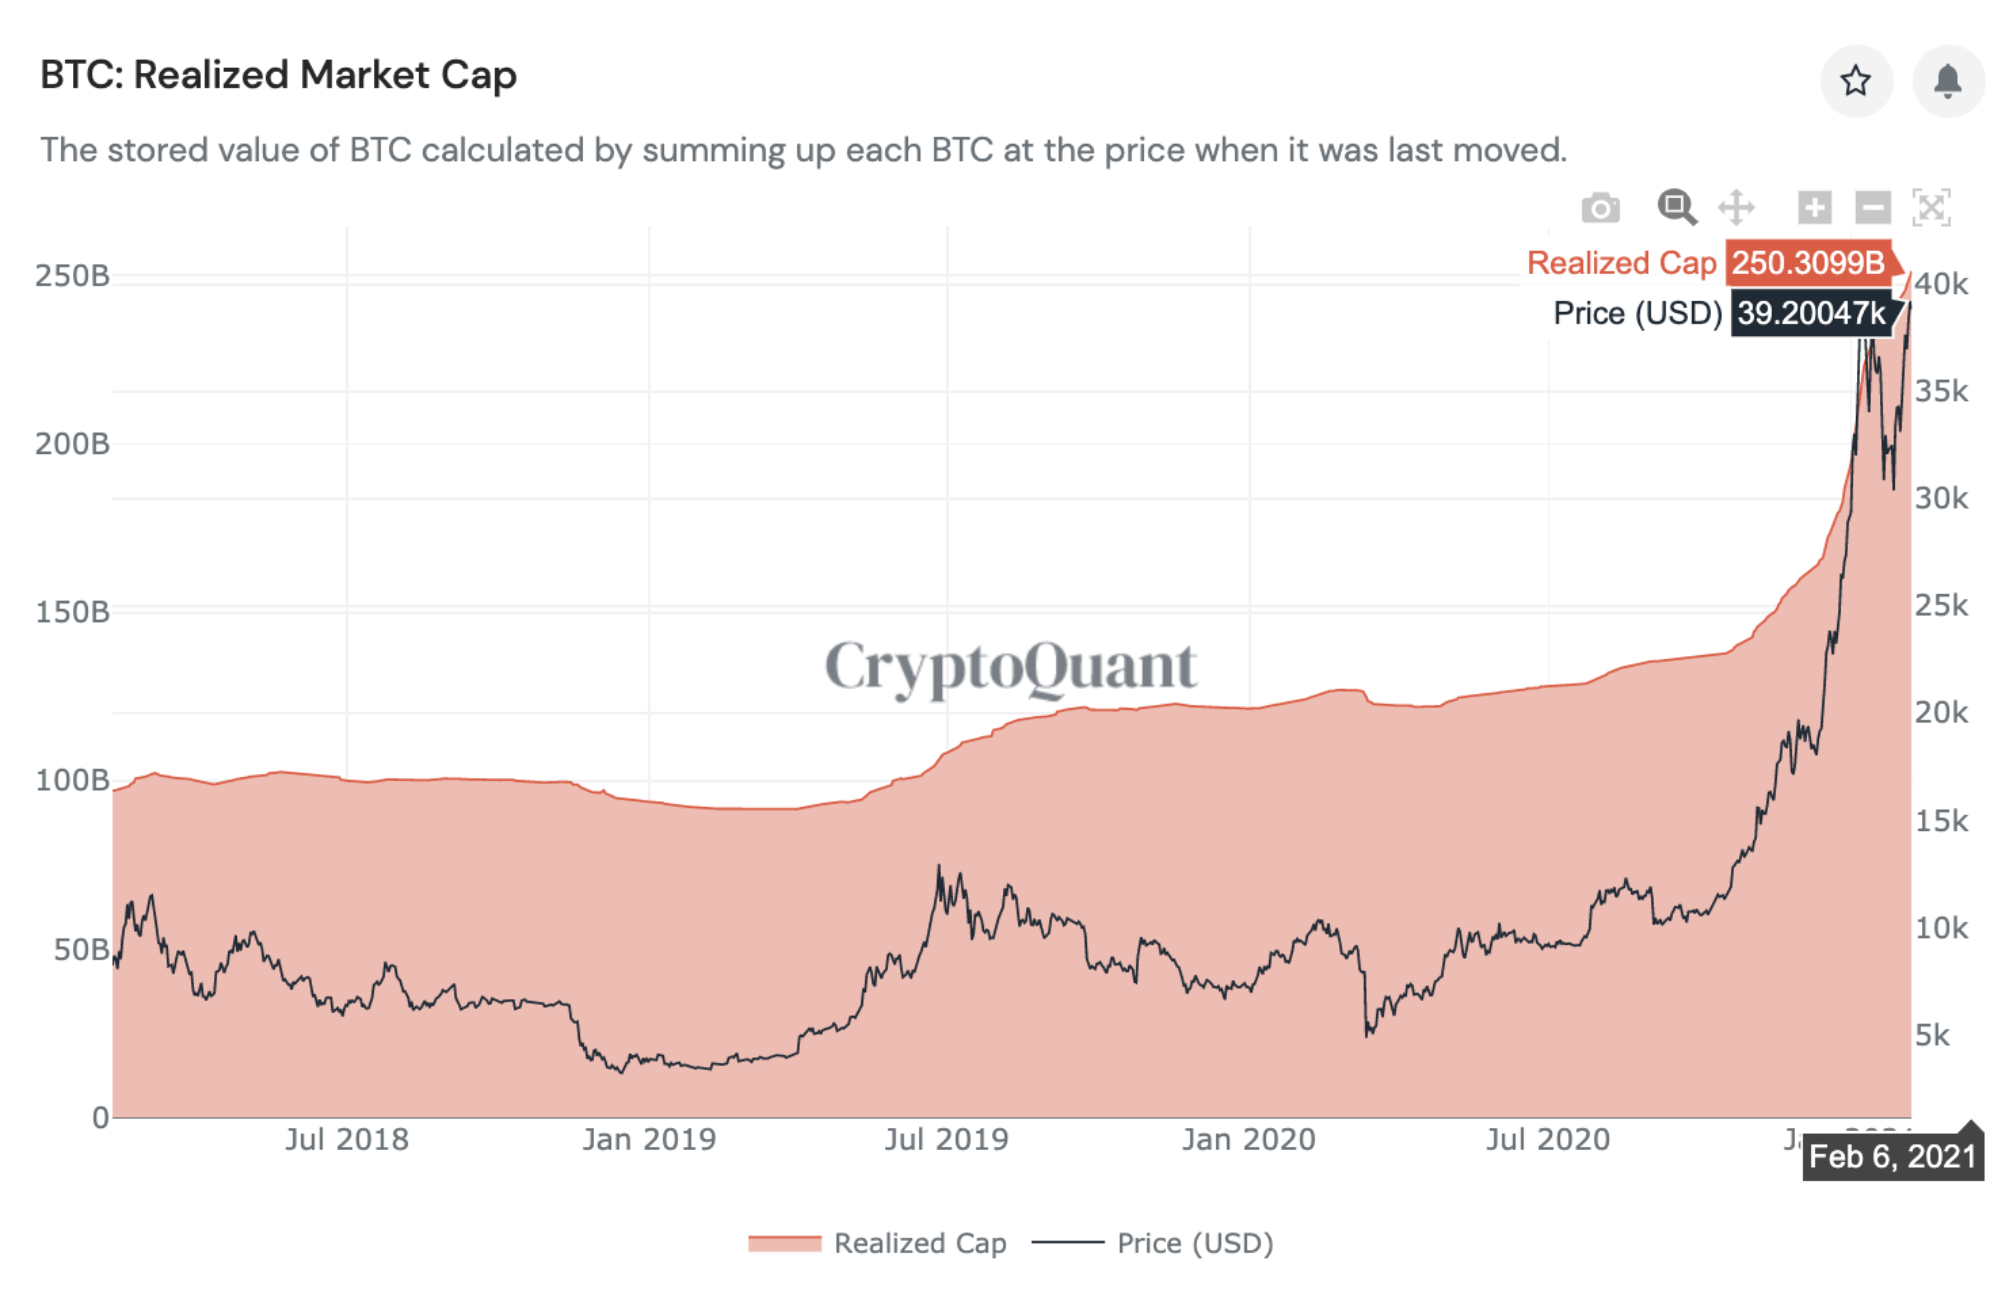
For over 5 years, 22% of all the Bitcoin has not been moved at all indicating that 22% of Bitcoins are lost, unclaimed, or locked. If this 22% could be recovered and be moved, that would have a huge impact on the market because 22% of all Bitcoins is a very large amount. That is why people get scared of large transactions that could imbalance space.
Interviewer , Editor : Lina Kamada
【Disclaimer】
The Article published on this our Homepage are only for the purpose of providing information. This is not intended as a solicitation for cryptocurrency trading. Also, this article is the author’s personal opinions, and this does not represent opinion for the Company BTCBOX co.,Ltd.